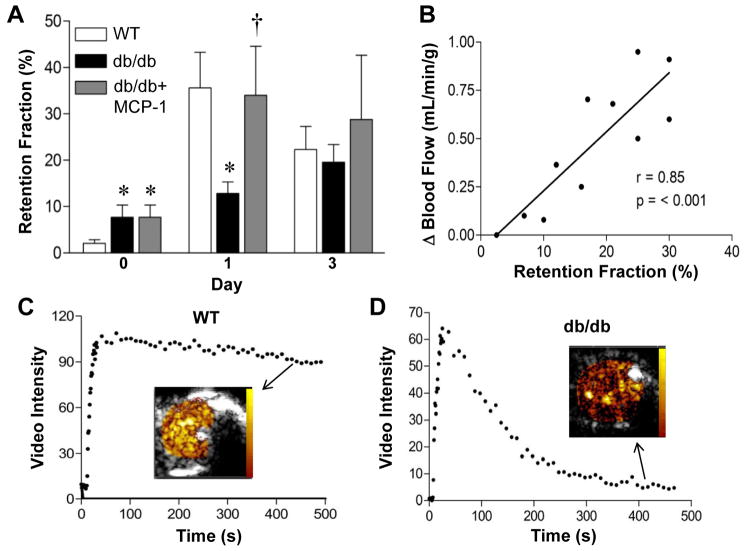
Figure 3.
Targeted CEU molecular imaging of P-selectin. (A) Retention fraction for P-selectin targeted microbubbles prior to (day 0) and at days 1 and 3 after arterial ligation. Baseline data for MCP-1-treated and untreated db/db mice are identical since these represent combined pre-treatment data. *p<0.01 vs wild-type; †p<0.05 vs untreated db/db mice. See online supplement for number of observations for each data point. (B) Relation between retention fraction of P-selectin microbubbles on day 1 and subsequent change in blood flow between day 1 and 21. (C and D) Examples of time-intensity data from the proximal hindlimb adductor muscle after intravenous injection of P-selectin-targeted microbubbles illustrating differences in muscle retention fraction from a wild-type and db/db mouse one day after arterial ligation. Examples of backround-subtracted video color-coded (scale at left) video intensity near the end of the acquisition are illustrated.

