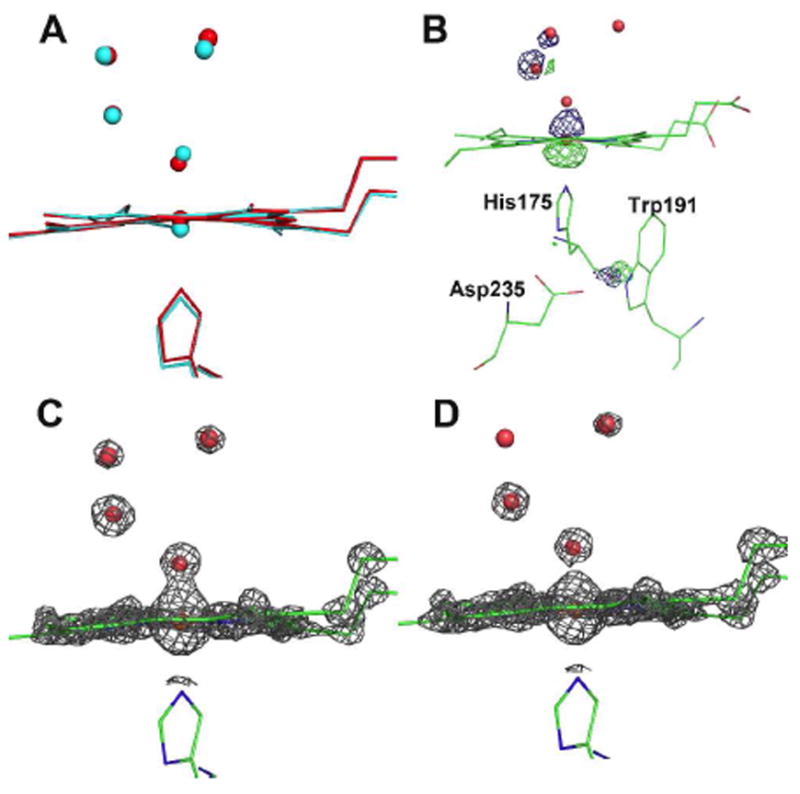
Figure 2.

A) Superposition of the low dose structure (red) on the Fe(III) structure (cyan). Note that the iron is displaced below the plane of the heme in the Fe(III) structure and above the plane of the heme in the low dose structure; B) Fo(low dose)-Fo(high dose) electron density difference map using phases obtained from the low dose structure. The map is contoured at -5.0σ (green) and +5.0σ (blue); C and D) 2Fo-Fc electron density maps contoured at 4.0σ for the dose data set 1 (panel C) and high dose data set 15 (panel D). Oxygen and water molecules are represented by the small spheres.
