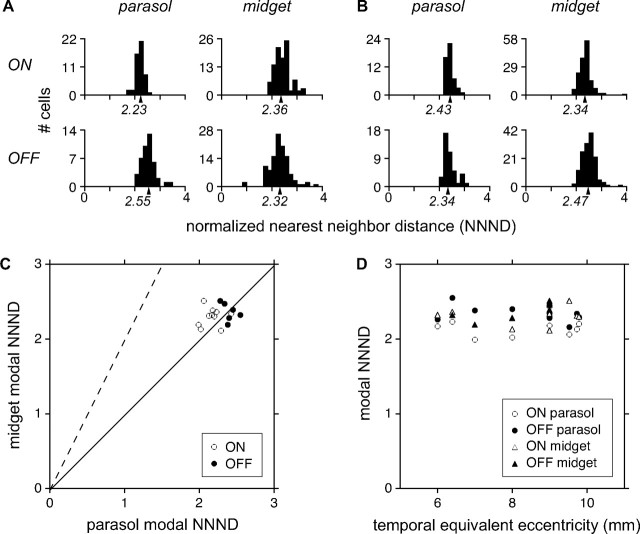
Figure 2.
Quantitative analysis of RF overlap. The normalized nearest neighbor distance (NNND) expresses RF spacing relative to RF size; if two mosaics have the same degree of RF overlap, they will have the same NNND. A, NNND values for the mosaics of parasol and midget cells shown in Figure 1B, with the modal NNND indicated on the abscissa. Because the recordings did not sample every cell in the mosaic, the modal NNND was computed using the mean of the densest 75% of values, which excluded outlying points. The robustness of this calculation was confirmed by subsampling analysis (see Materials and Methods). B, Similar data, for the preparation in Figure 1C. C, Data summarizing the RF overlap of 36 mosaics. Modal NNND values of simultaneously recorded parasol and midget mosaics are compared separately for ON cells (open circles) and OFF cells (filled circles). Solid line indicates equality, dashed line indicates the prediction from anatomical findings that NNND should be approximately twice as large for midget cells. D, NNND values as a function of retinal eccentricity, for ON (open) and OFF (filled) cells of both midget (triangle) and parasol (circle) types.

