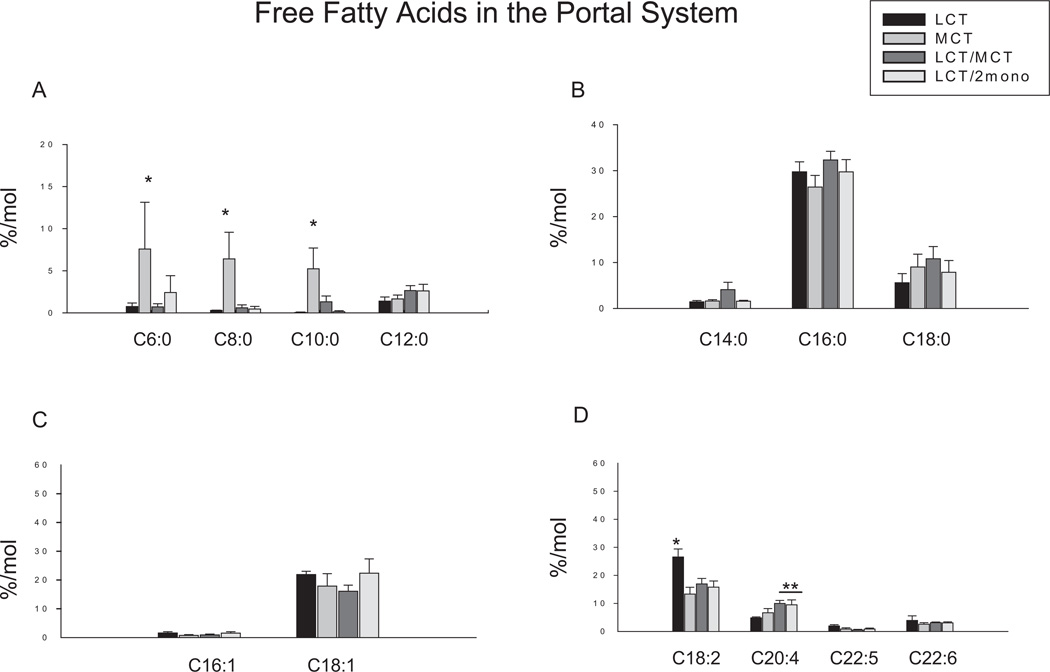
Figure 1.
Effects of different diets on fatty acid profiles in free fatty acid fraction in the portal vein plasma. Results are depicted in the bar graphs, where the data represent the mean ± SEM for 6–8 rats per group. Each bar corresponds to the group indicated by different diets. LCT, a diet containing lipid source with 100% of long-chain triglycerides (n = 6); MCT, a diet containing lipid source with 100% of medium-chain triglycerides (n = 7); LCT/MCT, a diet containing lipid source with 50:50 of long-chain triglycerides and medium-chain triglycerides (n = 6); LCT/2mono, a diet containing lipid source with 50:50 of long-chain triglycerides and 2-monododecanoin (n = 8). (A) Fatty acids with carbons ranging from 6 to 12. C6:0, caproic acid; C8:0, octanoic acid; C10:0, decanoic acid; C12:0, dodecanoic acid. (B) Saturated fatty acids. C14:0, myristic acid; C16:0, palmitic aicd; C18:0, stearic acid. (C) Monounsaturated fatty acids. C16:1, palmitoleic acid; C18:1, oleic acid. (D) Polyunsaturated fatty acids. C18:2, linoleic acid; C20:4, arachidonic acid; C20:5, eicosapentaenoic acid; C22:6, docosahexaenoic acid. *P < .05 vs all other groups; **P < .05 vs LCT group by 1-way ANOVA with least significant difference test.

