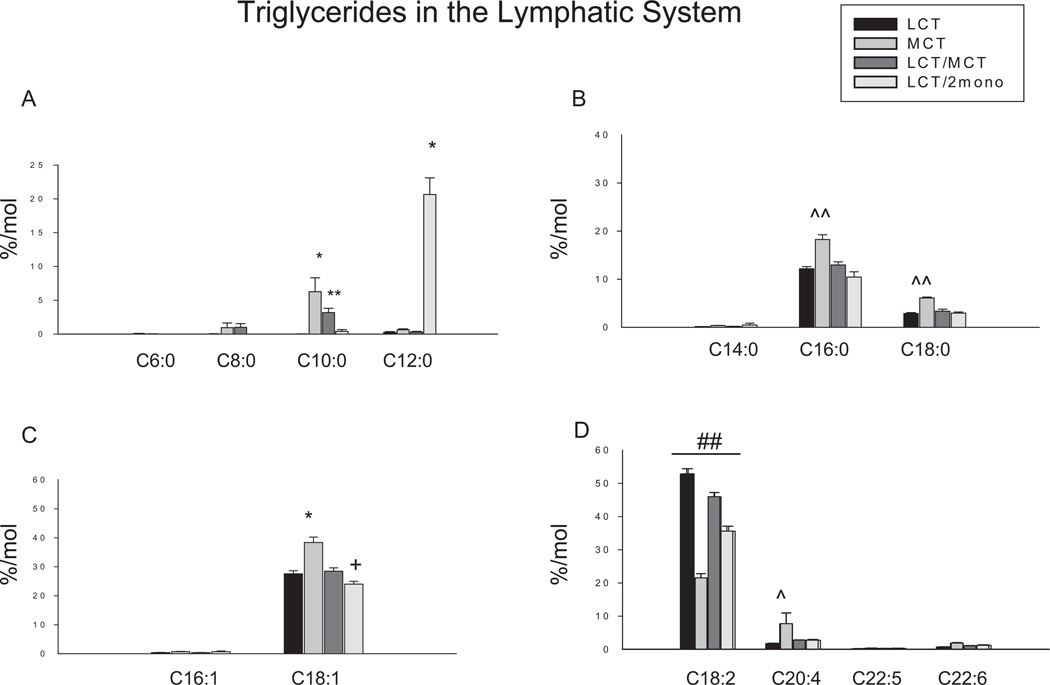
Figure 2.
Effects of different diets on fatty acid profiles in triglyceride fraction in the lymphatic fluid. Results are depicted in the bar graphs, where the data represent the mean ±SEM for 6–8 rats per group. Each bar corresponds to the group indicated by different diets. LCT, a diet containing lipid source with 100% of long-chain triglycerides (n = 6); MCT, a diet containing lipid source with 100% of medium-chain triglycerides (n = 7); LCT/MCT, a diet containing lipid source with 50:50 of long-chain triglycerides and medium-chain triglycerides (n = 6); LCT/2mono: a diet containing lipid source with 50:50 of long-chain triglycerides and 2-monododecanoin (n = 8). (A) Fatty acids with carbons ranging from 6 to 12. C6:0, caproic acid; C8:0, octanoic acid; C10:0, decanoic acid; C12:0, dodecanoic acid. (B) Saturated fatty acids. C14:0, myristic acid; C16:0, palmitic acid; C18:0, stearic acid. (C) Monounsaturated fatty acids. C16:1, palmitoleic acid; C18:1, oleic acid. (D) Polyunsaturated fatty acids. C18:2, linoleic acid; C20:4, arachidonic acid; C20:5, eicosapentaenoic acid; C22:6, docosahexaenoic acid. *P < .001 and **P < .001 vs all other groups; ^^P < .05 and ^P < .05 vs all other groups; +P < .05 vs LCT/MCT and ##P < .001 vs each other by 1-way ANOVA with least significant difference test.

