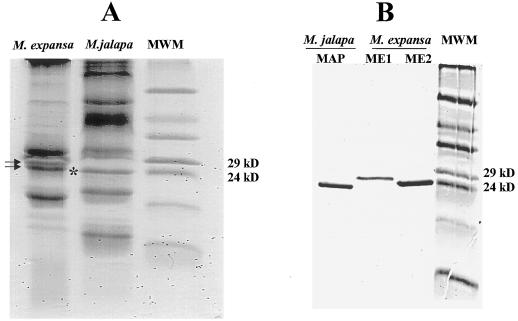
Figure 3.
A, Comparison of the total root-protein patterns from M. expansa and M. jalapa. The arrows indicate ME1 (top arrow) and ME2 (bottom arrow) in M. expansa, and the asterisk indicates MAP in M. jalapa. B, Comparison of the RIP from M. jalapa (MAP) and the two proteins isolated from M. expansa (ME1 and ME2). Samples were extracted as described in Methods. About 15 and 3 μg of total and individual proteins, respectively, were loaded.

