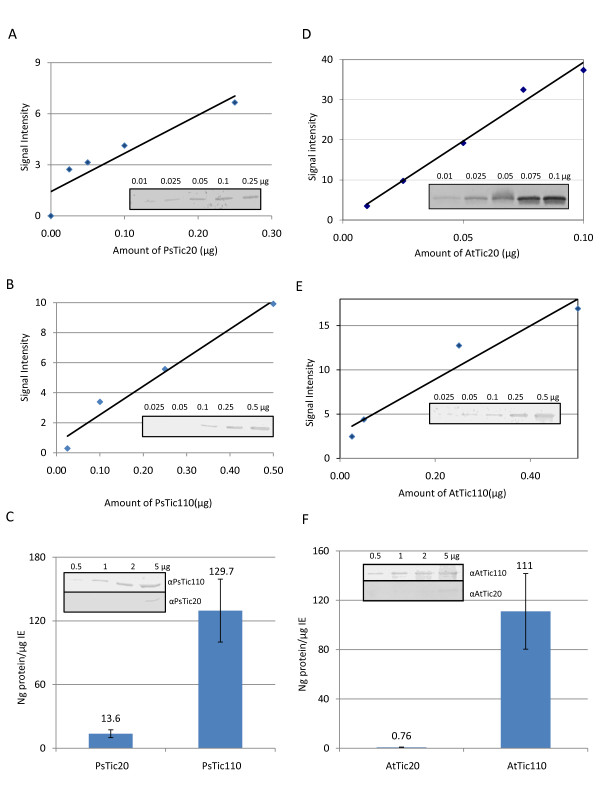
Figure 2.
Protein levels of Tic20 and Tic110 in envelope membranes. Semi-quantitative analysis of Tic20 and Tic110 protein levels in (A-C) Pisum sativum (Ps) and (D-F) Arabidopsis thaliana (At). A dilution series of purified PsTic20, PsTic110, AtTic20 and AtTic110 was quantified after immunodetection with specific antibodies (A, B, D and E in inset). Calibration curves were calculated using known concentrations of proteins plotted against the quantified data (A, B, D and E). These curves were used to determine the amount of Tic20 and Tic110 in (C) pea and (F) Arabidopsis envelope samples. Insets in (C) and (F) show dilution series of corresponding envelopes after immunodetection with the indicated antibody. Presented data are the average of two independent experiments; a representative result is depicted.

