Figure 6.
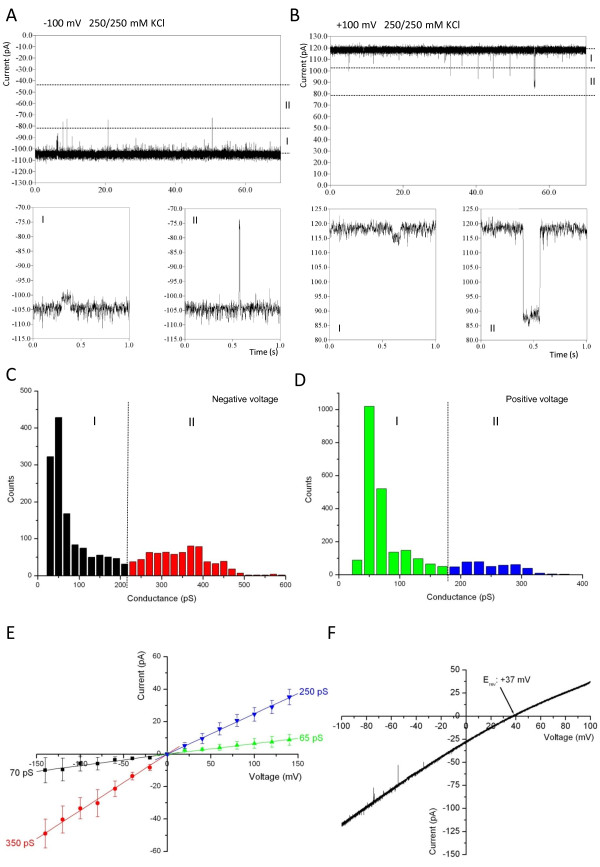
Electrophysiological characterization of Tic20. (A) and (B) Current traces of a Tic20 channel in lipid bilayer at -100 mV and +100 mV, respectively. Dotted lines indicate thresholds of each conductance class (I and II). Lower panels show representative gating events belonging to each class. (C) and (D) Conductance histograms of all gating events of Tic20 at negative and positive voltages, respectively. Colours represent different conductance classes (I and II). (E) Current-voltage relationship diagram of all analysed gating events ordered in the four indicated conductance classes using the same colour code as in (C) and (D). Indicated conductance values correspond to the slope of fitted linears in each class. (F) A representative voltage ramp of Tic20 demonstrating the cation selectivity of the channel with a positive reverse potential (Erev). Measurements were performed under symmetrical (A)-(E) and asymmetrical (F) buffer conditions (20 mM MOPS/Tris (pH 7.0), 250 mM and 20/250 mM KCl, respectively). Presented data derive from two independent fusions accounting for more than 4500 gating events and 16 voltage ramps.

