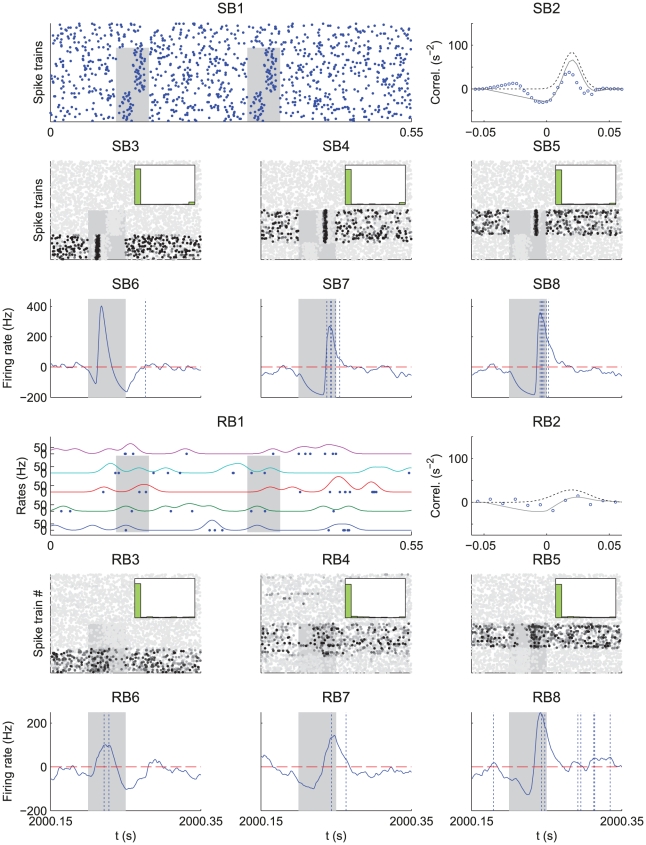
Figure 4. Influence of the spike distribution within the pattern.
Comparison between a spike pattern of model SB (SB panels) and a rate-modulated pattern of Model RB (RB panels), both having a bimodal distribution of latencies. (SB1) Model SB. The plot displays  afferents that fire with a mean latency
  ms with a spread
  ms around this latency, and
  afferents that fire with a mean latency
  ms and same spread
  ms. (SB2) The average cross-correlogram over the respective groups (circles) corresponds to Equation (16). (RB1) Model RB. The plot displays two afferents of each group. In each group all the afferents have the same pattern rate function: Gaussians centered respectively on
  ms and
  ms with width
  ms and amplitudes
  . (RB2) The cross-correlogram between two afferents in distinct groups exhibits a peak at
  ms. Plots SB3–8 and RB3–8 are similar to those in Fig. 3. (SB3,SB6 and RB3,RB6)
  and
and  : the earliest cluster is selected. (SB4,SB7 and RB4,RB7)
  and
and  : the latest cluster is selected. (SB5,SB8 and RB5,RB8)
  and
and  : the latest cluster is selected.

