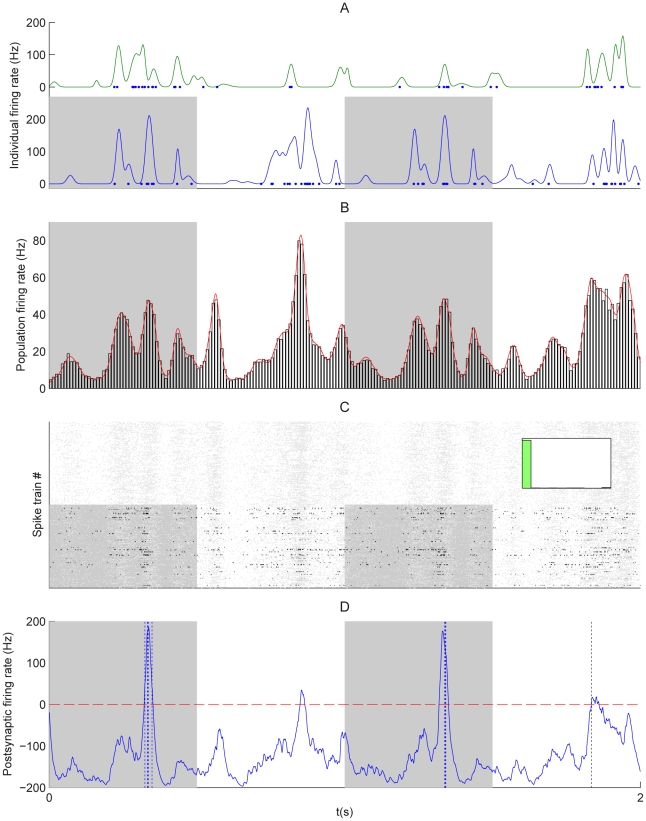
Figure 7. Long pattern of model R with duration  ms and global time-varying spike density.
(A) Individual rate functions for a pattern (bottom) and a non-pattern (top) input. During all pattern presentations (grey areas), the pattern input exhibits the same rate modulations (similar plot to Fig. 1R1). The width of rate peaks is randomly chosen around  ms and the amplitudes (e.g.
  ) are multiplied by a common temporal envelope (see text). (B) Population-averaged spike histogram (bars) and theoretical firing rate (solid line, average of individual rate functions of (A)). (C and D) Input raster plot and lumped EPSP response after learning (similar to Fig. 3). The black cluster in (C) indicates that the third population peak in the pattern in (B) has been selected. The inset displays the bimodal final weight distribution and shows that only a few weights were potentiated. While remaining sensitive to the mean input spike rate in (B), the postsynaptic neuron is above all selective to the third pattern peak for the two presentations displayed in (D).

