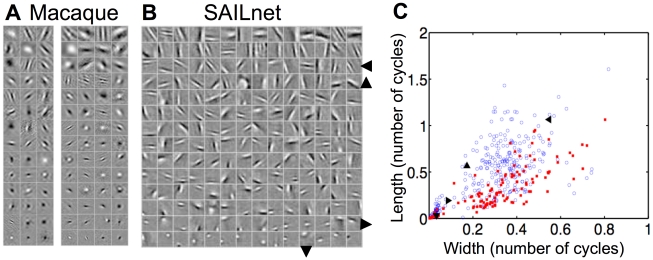
Figure 3. SAILnet learns receptive fields (RFs) with the same diversity of shapes as those of simple cells in macaque primary visual cortex (V1).
(A) 98 randomly selected receptive fields recorded from simple cells in macaque monkey V1 (courtesy of D. Ringach). Each square in the grid represents one neuronal RF. The sizes of these RFs, and their positions within the windows, have no meaning in comparison to the SAILnet data. The data to the right of the break line have an angular scale (degrees of visual angle spanned horizontally by the displayed RF window) of  , whereas those to the left of it span
  . (B) RFs of 196 randomly selected model neurons from a 1536-unit SAILnet trained on patches drawn from whitened natural images. The gray value in all squares represents zero, whereas the lighter pixels correspond to positive values, and the darker pixels correspond to negative values. All RFs are sorted by a size parameter, determined by a Gabor function best fit to the RF. The SAILnet model RFs show the same diversity of shapes as do the RFs of simple cells in macaque monkey V1 (A); both the model units and the population of recorded V1 neurons consist of small unoriented features, oriented Gabor-like wavelets containing multiple subfields, and elongated edge-detectors. (C) We fit the SAILnet and macaque RFs to Gabor functions (see Methods section), in order to quantify their shapes. Shown are the dimensionless width and length parameters (
 and
and  , respectively) of the 299 SAILnet RFs and 116 (out of 250 RFs in the dataset) macaque RFs for which the Gabor fitting routine converged. These parameters represent the size of the Gaussian envelope in either direction, in terms of the number of cycles of the sinusoid. The SAILnet data (open blue circles) span the space of the macaque data (solid red squares) from our Gabor fitting analysis; SAILnet is accounting for all of the observed RF shapes. We highlight four SAILnet RFs with distinct shapes, which are identified by the large triangular symbols that are also displayed next to the corresponding RFs in panel (B).

