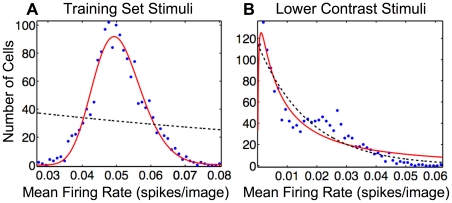
Figure 4. Units in SAILnet exhibit a broad range of mean firing rates, which can be lognormally or exponentially distributed depending on the choice of probe stimuli.
(A) Frequency histogram of firing rates averaged over  image patches drawn from the training ensemble for each of the 1536 units of a SAILnet trained on whitened natural images. All learning rates were set to zero during probe stimulus presentation. A wide range of mean rates was observed, but as expected, the distribution is peaked near
  spikes per image, the target mean firing rate of the neurons. The paucity of units with near-zero firing rates suggests that this distribution is closer to lognormal than exponential. Accordingly, the lognormal least-squares (solid red curve) fit accounts for
  of the variance in the data, whereas the exponential fit (black dashed curve) accounts for only
  . (B) In response to low contrast stimuli, the firing rate distribution across the units (every unit fired at least once) in the same network as in panel (A) was similarly well fit by either an exponential (dashed black curve; accounting for
  of the variance in the data) or a lognormal function (solid red curve; accounting for
  of the variance). The low-contrast stimulus ensemble used to probe the network consisted of images drawn from the training set, with all pixel values reduced by a factor of three.

