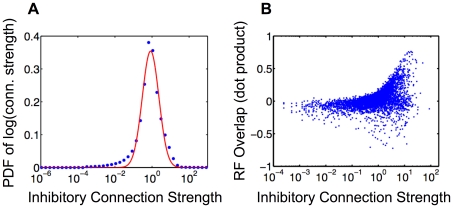
Figure 6. Connectivity learned by SAILnet allows for further experimental tests of the model.
(A) Probability Density Function (PDF) of the logarithms of the inhibitory connection strengths (non-zero elements of the matrix  ) learned by a 1536 unit SAILnet trained on
  pixel patches drawn from whitened natural images. The measured values (blue points) are well-described by a Gaussian distribution (solid line), which accounts for
  of the variance in the dataset. This indicates that the data are approximately lognormally distributed. Note that there are some systematic deviations between the Gaussian best fit and the true distribution, particularly on the low-connection strength tail, similar to what has been observed for excitatory connections within V1 [18]. This plot was created using the binning procedure of Hromádka and colleagues [20]. The histogram was normalized to have unit area under the curve. (B) The strengths of the inhibitory connections between pairs of cells are correlated with the overlap between those cells' receptive fields: cells with significantly overlapping RFs tend to have strong mutual inhibition. Data shown in panel (B) are for 5,000 randomly selected pairs of cells. Pairs of cells with significantly negatively overlapping RFs tend not to have inhibitory connections between them, hence the apparent asymmetry in the RF overlap distribution obtained by marginalizing over connection strengths in panel (B).

