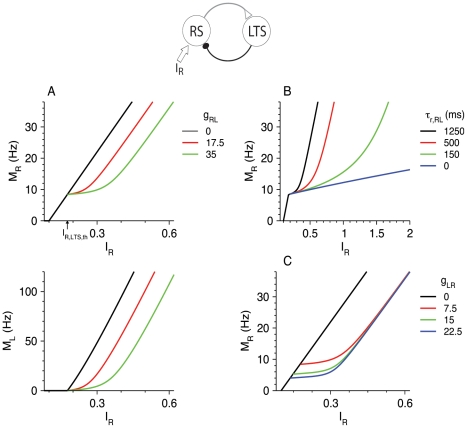
Figure 2. Steady-state response of the RS-LTS network with g RR = 0 to constant inputs to the RS neurons.
(A) M R-I R curves (top panel) and M L-I R curves (bottom panel) are plotted for g RL = 0 (black), 17.5 (red) and 35 (green). Additional parameters are τr ,RL = 1250 ms, gLR = 7.5. The arrow below the abscissa in the top panel points to the value of I R,LTS,th. (B) M R-I R curves are plotted for τr ,RL = 1250 ms (black), 500 ms (red) and 150 ms (green) and 0 (blue). Additional parameters are g RL = 35, gLR = 7.5. (C) M R-I R curves are plotted for gLR = 0 (black), 7.5 (red), 15 (green) and 22.5 (blue). Additional parameters are g RL = 35, τr ,RL = 1250 ms.

