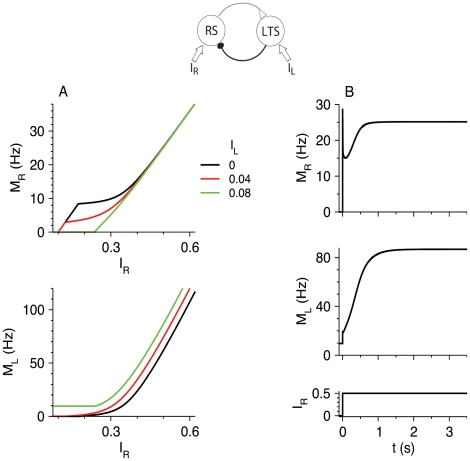
Figure 4. Response of the RS-LTS network with input I L>0 to LTS neurons.
Additional parameters are g RL = 35, gLR = 7.5, g RR = 0. (A) M R-I R curves (top panel) and M L-I R curves (bottom panel), representing the steady-state response of the circuit to the inputs I R and I L to the RS and LTS neurons respectively, are plotted for I L = 0 (black), 0.04 (red) and 0.08 (green). (B) Response of the circuit to a step input I RΘ(t) to the RS neurons. Time courses of M R (top panel) and M L (middle panel) are plotted for I R = 0.5 (bottom panel). The current I L = 0.08 remains constant.

