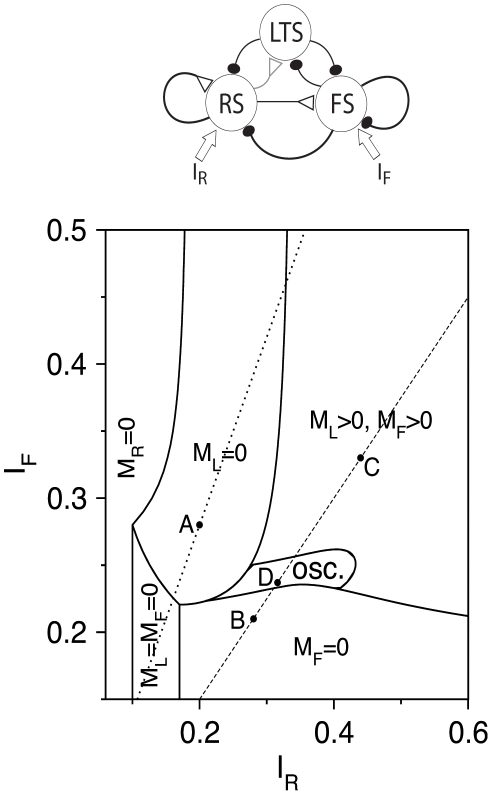
Figure 9. Phase diagram of the steady-state behavior of an RS-LTS-FS network ( Table 2 ) in the I R−I F plane.
Regimes are defined according to the network state at large times. The network reaches a rest state with constant M R, M L, and M F in all the regimes except of the oscillatory regime, denoted by “osc.”. In the regime denoted by “M R = 0”, RS cells are quiescent; they are active in all other regimes. Those regimes are defined according to the activity of LTS and FS neurons. FS neurons are active and LTS neurons are quiescent in the regime denoted by “M L = 0”, LTS neurons are active and FS neurons are quiescent in the regime denoted by “M F = 0”, and both neuronal populations are active in the regime denoted by “M L>0, M F>0”. The dotted and dashed lines denote the ratios I F = 1.4 I R and I F = 0.75 I R respectively, for which calculations shown in Figure 10 are made. The solid circles labeled “A”–“D” denote values of I F and I R for Figure 11A–D.

