
Figure 12. Oscillatory response of the reduced RS-LTS-FS network to constant inputs.
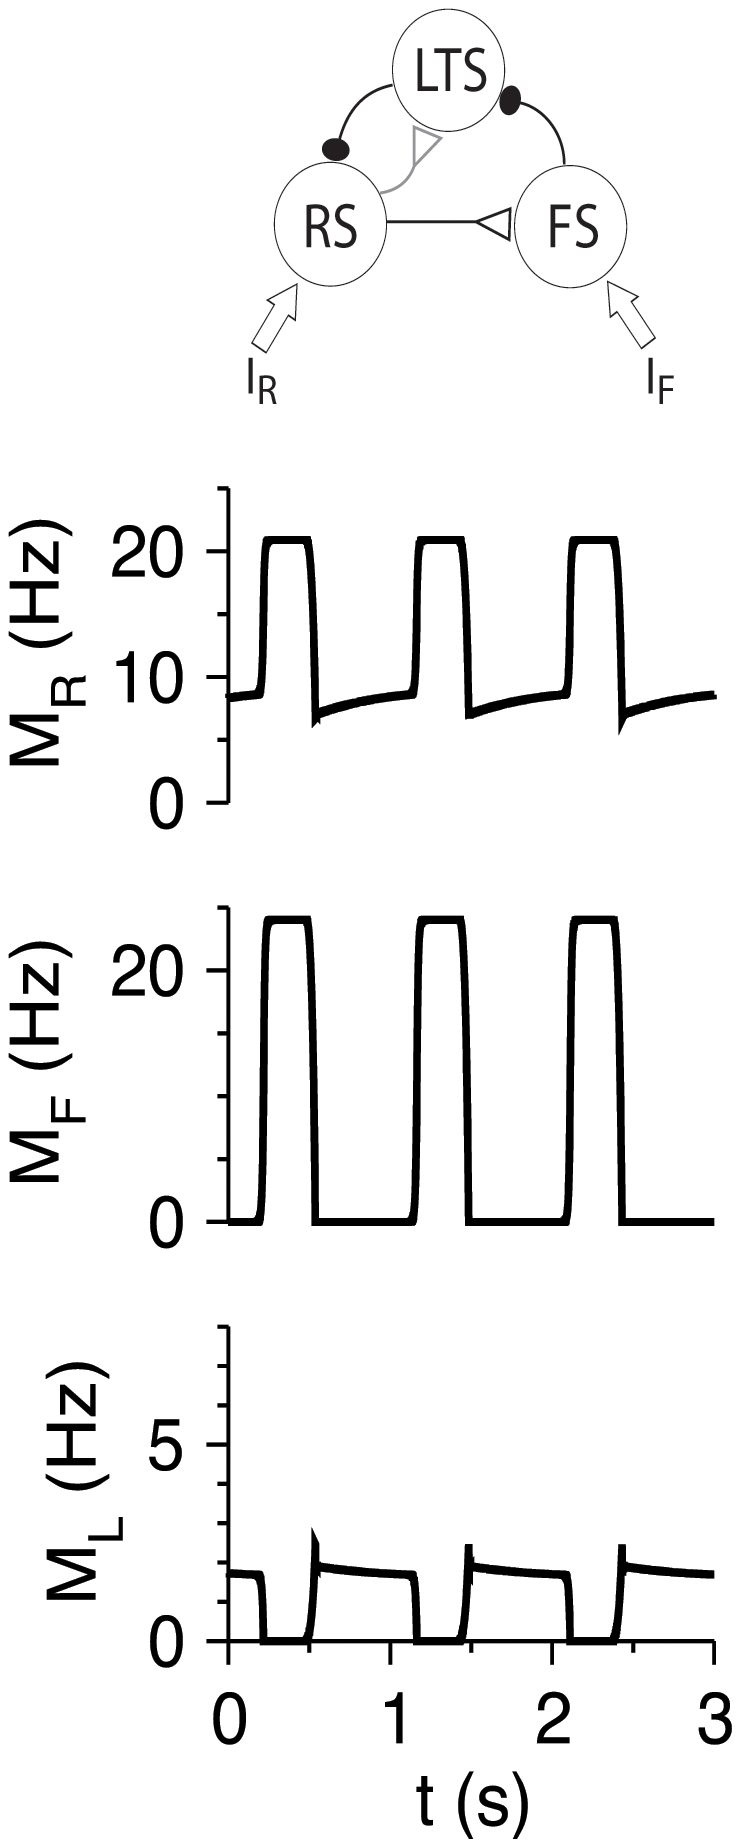
Time courses of M R (top panels), M F (middle panels) and M L (middle panels) are plotted during the oscillatory state (limit cycle). Parameters that are different than those listed in Table 2 are: g LR = 7.5, g RR = 0, g FR = 9.3, g LF = 8, g RR = g RF = g FL = g FF = 0, τr = 0 for all the synapses. Additional parameters: I R = 0.29, I F = 0.232.