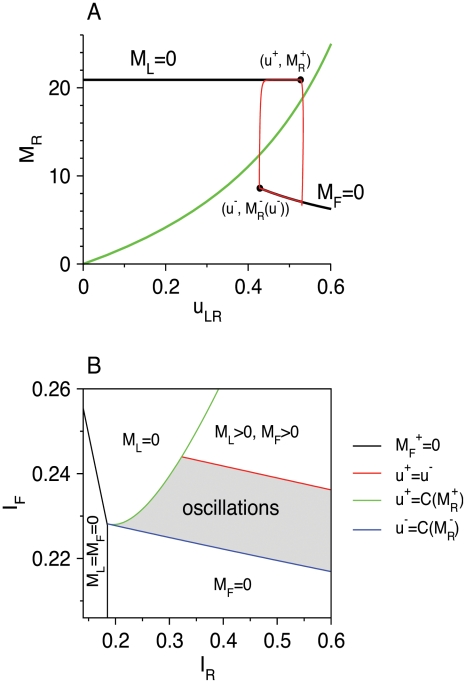
Figure 13. Fast-slow analysis of network oscillations: analysis of the reduced model.
Synaptic parameters are as in Figure 12. (A) The bifurcation diagram of the fast subsystem is presented by plotting M
R as a function of the parameter u
LR. Solid black lines denote branches of stable fixed points; M
L = 0 on the upper line and M
F = 0 on the lower line. The points  and
and  (Equations 31, 32) are denoted by black solid circles. The green line denotes the slow nullcline of Equation 30, u
LR = CM
R/(1+CM
R). The red line denotes the projection of the limit cycle of the full dynamical system (Equations 1, 3–6) on the M
R–u
LR plane. Parameters: I
R = 0.29, I
F = 0.232. (B) Phase diagram of the RS-LTS-FS network in the I
R−I
F plane. The network exhibits slow network oscillations in the grey area. Outside of this regime, the network reaches a steady state with constant M
R, M
L, and M
F. The LTS and FS populations are quiescent to the left of the black line. To the right of the black line and below the blue line, M
F = 0 and M
L>0. To the right of the black line and to the left and above the green line, M
L = 0 and M
F>0. To the right of the green line and above the red line, M
L>0 and M
F>0.

