Figure 6.
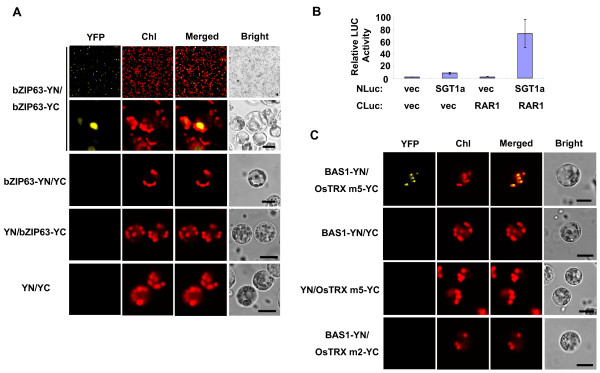
Protein-protein interaction assays in rice green tissue protoplasts. A, Protein-protein interaction analysis by BiFC. Construct pairs of pUC-bZIP63-YN (bZIP63-YN) and pUC-bZIP63-YC (bZIP63-YC), bZIP63-YN and pUC-SPYCE (YC), pUC-SPYNE (YN) and bZIP63-YC, or YN and YC were transiently co-expressed in rice green tissue protoplasts. BiFC fluorescence is indicated by the YFP signal. Individual and merged images of YFP and chlorophyll autofluorescence (Chl) as well as bright field images of protoplasts are shown. The upper panel contains low power images showing high co-expression efficiency. Scale bars = 10 μm. B, Protein-protein interaction analysis by FLC. Constructs as indicated plus the RNL construct as an internal control were transiently co-expressed in rice green tissue protoplasts. Firefly luciferase activity was normalized to RNL activity. Values are means, with standard errors indicated by bars, representing 3 replicates. C, Construct pairs of pUC-BAS1-YN (BAS1-YN) and pUC-OsTRX m5-YC (OsTRX m5-YC), BAS1-YN and YC, YN and OsTRX m5-YC, or BAS1-YN and pUC-OsTRX m2-YC (OsTRX m2-YC) were transiently co-expressed in rice green tissue protoplasts. BiFC fluorescence is indicated by the YFP signal. Individual and merged images of YFP and chlorophyll autofluorescence (Chl) as well as bright field images of protoplasts are shown. Scale bars = 10 μm.

