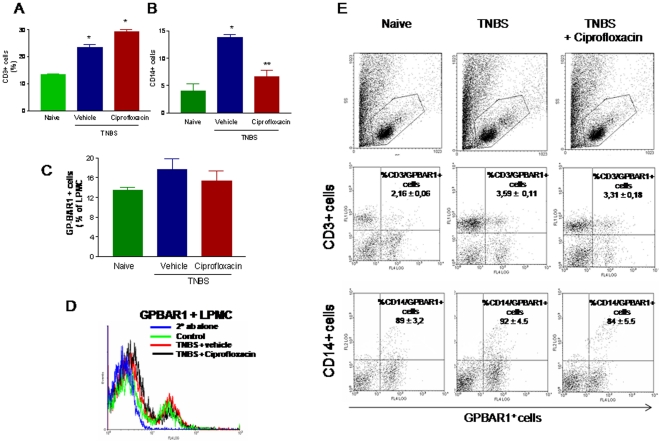
Figure 5. Flow-cytometry analysis of GP-BAR1 expression in unfractioned lamina propria mononuclear cells (LPMC) and LPMC-derived CD3+(A) and CD14+ cells (B) obtained from colons of naïve mice and mice administered TNBS alone and in combination with ciprofloxacin (n = 6; *P<0.05 versus naïve mice, **P<0.05 versus TNBS mice).
Panel C. Bar graphs of quantitative expression of GP-BAR1 in unfractioned LPMC. Panel D. Flow cytometry histogram showing GP-BAR1 protein expression in LPMC in different treatment settings. Panel E. Representative Dot plot (forward scatter/ side Scatter) of LMPC obtained from colons of naïve and colitic mice treated with ciprofloxacin. Representative dot plot graphs of relative expression of GP-BAR1 CD3+ and CD14+ cell obtained from LPMC. The numerical values indicate the means ± SE of % double positive cells.

