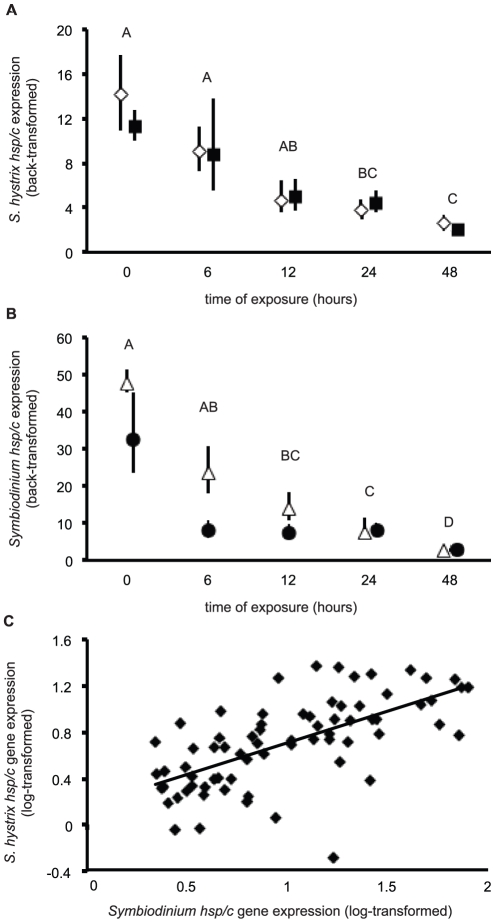
Figure 5. Host and Symbiodinium hsp/c mRNA expression results from the thermal stress experiment.
(A) Diamonds and squares represent mean host coral hsp/c expression for the control and elevated temperature treatments, respectively. (B) Triangles and circles represent mean Symbiodinium hsp/c expression for the control and elevated temperature treatments, respectively. In both panels, error bars represent standard error of the back-transformed mean, and Tukey's post-hoc groups represent α<0.05 significance levels for temporal variation only, as there were no significant treatment or interaction effects on host or Symbiodinium hsp/c gene expression (Table 2). In some cases, error bars do not extend beyond the icon. (C) The correlation between host and Symbiodinium log-transformed hsp/c expression across all samples.

