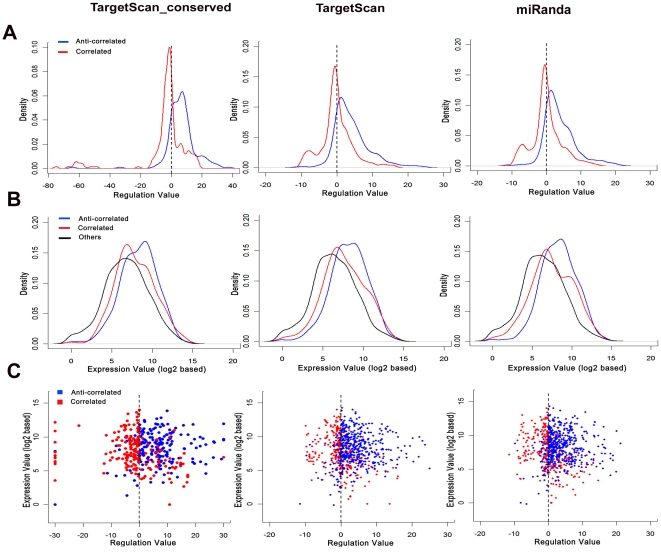
Figure 3. miRNA regulation analysis.
We classified all expression-variable mRNAs during lung cancer development based on their relationship with miRNAs. The results are classified into correlated, anti-correlated, and others (no correlation). The correlated mRNAs show correlated expressions to their regulatory miRNA expressions and the anti-correlated mRNAs are not. Three different methods were used to predict potential miRNA targets: “Conserved” are those genes that have conserved miRNA binding sites among vertebrates or mammals, and these genes were predicted by using the P CT method of TargetScan; “TargetScan” are those genes that are predicted by using a perl script of TargetScan without considering conservation. “miRanda” are those genes that are predicted potential targets based on miRanda v3.3a on Linux platform. (A) Gene distribution of the correlated and anti-correlated mRNAs was plotted based on their miRNA regulation values. (B) Gene distribution of the three groups of mRNAs was plotted based on their expression values. The expression value was defined by referencing that of the adjacent normal tissue (log2). (C) The relationship between gene expression and miRNA regulation.

