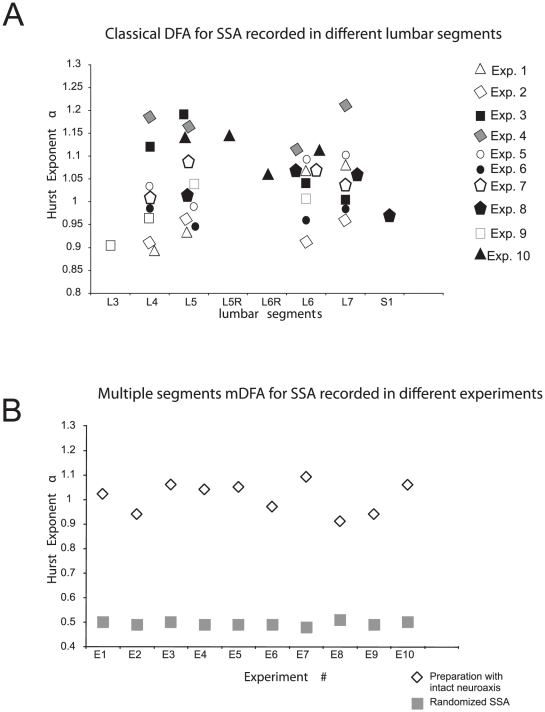
Figure 2. Detrended Fluctuation Analysis.
A. Classical DFA computed for spontaneous spinal activity (SSA). In 10 experiments spontaneous CDPs (Cord Dorsum Potentials) recorded from a single spinal segment under initial conditions showed a Hurst exponent value of DFA- = 1.04
 0.09 (mean
  sd). The recordings of single segments were among L3 through S1 depending on the experiments protocol. The R
 line averaged was 0.98. See text for details. B. The Hurst exponent values (
 's) were obtained from mDFA for multiple spinal segments for four lumbar segments in 10 experiments under initial conditions (
 = 1.01
 0.06) with a R
 line = 0.98. Following randomization, the same set of data showed mDFA-
 = 0.49
 0.01, with an average R
 for line-fitting higher than 0.99.

