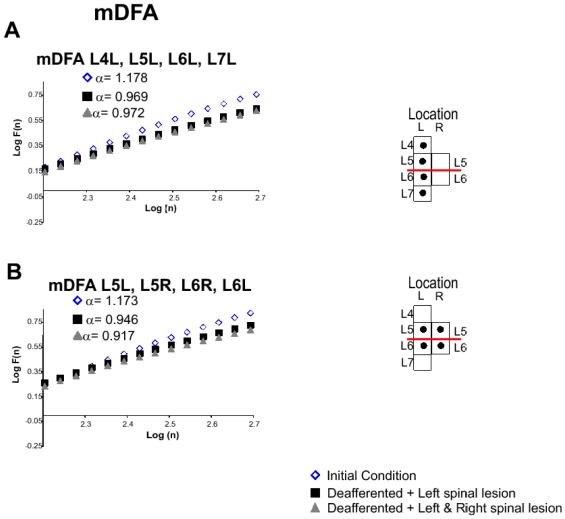
Figure 6. mDFA analysis of multiple recordings of the spontaneous activity in the cat spinal cord.
A. mDFA for L4 through L7 located in the left size. Inserts: Location of electrodes. B. mDFA for CDPs recordings near to the lesion, L5L-L5R-L6R-L6L. The regression line fit,  was above 0.99 in all cases. More details in text. The spinal lesion reduced significantly the fluctuations.

