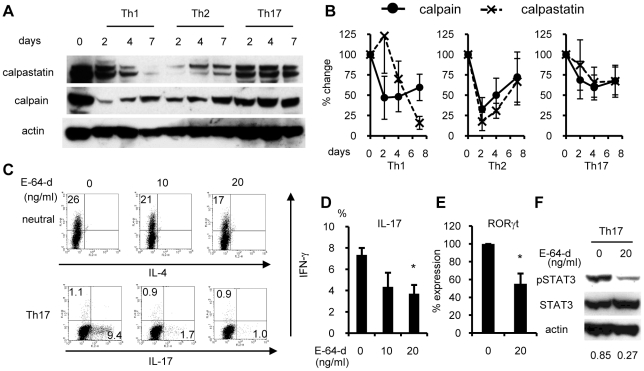
Figure 1. Calpastatin and calpain expressions and the effect of E-64-d on Th cell development.
(A) Naïve CD4+ T cells were cultured under Th1-, Th2-, or Th17-promoting conditions, and the lysates were subjected to western blot analysis with the indicated antibodies. Data are representative of four independent experiments. (B) Band densities from the four independent experiments described in panel A were measured and normalized against the density of actin, and are depicted as the percent change from the value on day 0. (C) Naïve CD4+ T cells were maintained with the indicated concentrations of E-64-d under neutral or Th17-promoting conditions. On day 4 (Th17 condition) or day 6 (neutral condition), the cells were restimulated with PMA/ionomycin for 4 hours and subjected to ICS. Similar results were obtained in four independent experiments. (D) Statistical analysis of the IL-17 positive rates in panel C under Th17 conditions. *p<0.05 vs. absence of E-64-d (DMSO only, n = 4). (E) Naïve CD4+ T cells were maintained with the indicated concentrations of E-64-d under Th17-inducing conditions. On day 3, total RNA was extracted and subjected to quantitative RT-PCR analysis for RORγt. Expression levels were normalized to HPRT. Data depict the average+SE of the percent change from the value in the absence of E-64-d (DMSO only, n = 6). *p<0.05 vs. absence of E-64-d. (F) Th17 cells were cultured with the indicated concentrations of E-64-d. On day 3, the cells were washed and maintained with X-VIVO™ 20 (without FCS), and then lysed and subjected to western blot using the indicated antibodies on day 4. Similar results were obtained in four independent experiments. Numbers below the blots are the average relative density of pSTAT3 to actin.

