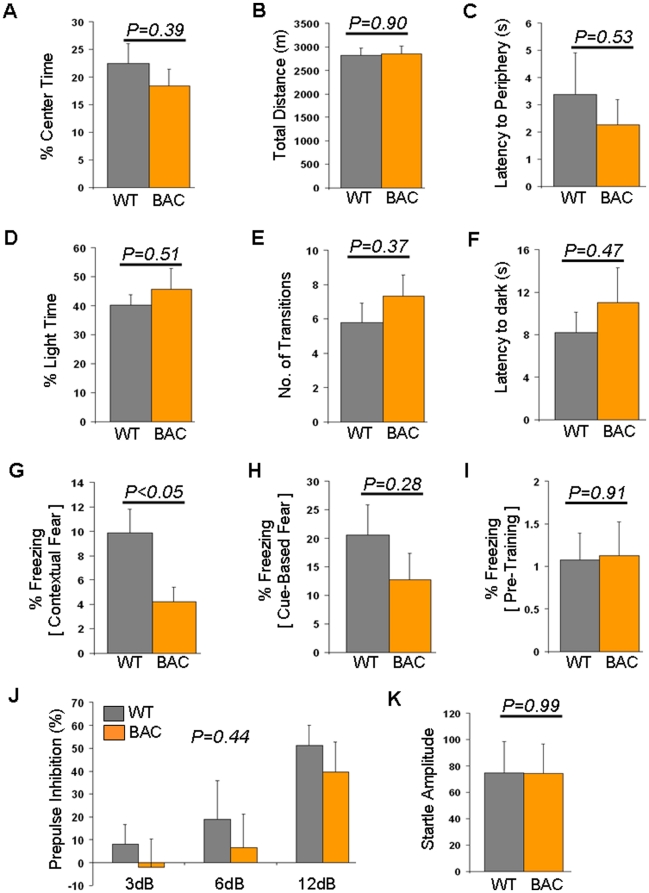
Figure 2. Behavioral analyses from Tcf7l2 overexpression.
(A)–(C) Open field testing. (A) Center time shown as a percent of total time (%) in wild-type (WT, n = 9) and BAC transgenic (BAC, n = 9) mice. (B) Total distance shown in meters (m) in wild-type (WT, n = 9) and BAC transgenic (BAC, n = 9) mice. (C) Latency to periphery shown in seconds (s) in wild-type (WT, n = 9) and BAC transgenic (BAC, n = 9) mice. (D)–(F) Light dark box testing. (D) Time in light shown as a percent of total time (%) in wild-type (WT, n = 9) and BAC transgenic (BAC, n = 9) mice. (E) Number of transitions between the light and dark compartments in wild-type (WT, n = 9) and BAC transgenic (BAC, n = 9) mice. (F) Latency to the dark compartment shown in seconds (s) in wild-type (WT, n = 9) and BAC transgenic (BAC, n = 9) mice. (G) – (I) Fear conditioning. (G) Contextual fear shown as a percent time spent freezing (%) in wild-type (WT, n = 9) and BAC transgenic (BAC, n = 9) mice. (H) Cue-based fear shown as a percent time spent freezing (%) in wild-type (WT, n = 9) and BAC transgenic (BAC, n = 9) mice. (I) Pre-training freezing shown as a percent time spent freezing (%) in wild-type (WT, n = 9) and BAC transgenic (BAC, n = 9) mice. (J) Prepulse inhibition in wild-type (WT, n = 9) and BAC transgenic (BAC, n = 9) mice. Prepulse inhibition (%) using prepulses of 3, 6 and 12 decibels (dB) are shown. (K) Startle response in wild-type (WT, n = 9) and BAC transgenic (BAC, n = 9) mice. Wild-type data are shown in gray while BAC transgenic data are shown in orange.

