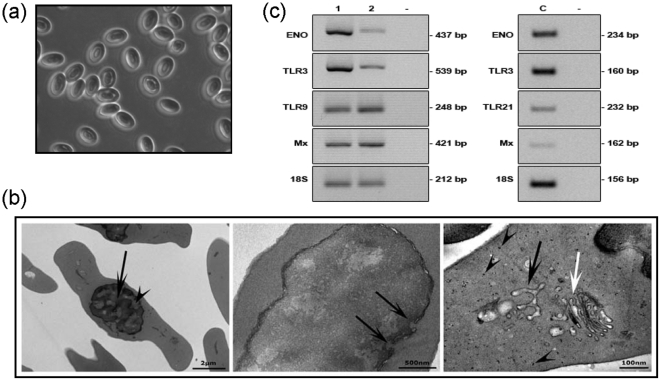
Figure 1. Model description of rainbow trout erythrocytes.
(a) General micrograph of cultured rainbow trout erythrocytes (×50). (b) TEM of trout erythrocyte cultures. Left panel, nucleus show condensed (arrow) and decondensed (arrowhead) chromatin; middle panel, trout erythrocyte nucleus with nuclear pores (arrows); right panel, erythrocyte with ribosomes (arrowheads), smooth endoplasmic reticulum (black arrow) and Golgi apparatus (white arrow). (c) Specific mRNA transcript expression (RT-PCR) in trout and chicken erythrocytes (ENO, enolase; TLR 3, 9 and 21, Toll-like receptors; Mx, myxovirus resistance 1). Left panel, 1) density gradient isolated cultured trout erythrocytes under control conditions; 2) cell sorted trout erythrocyte population from density gradients. Right panel, c) specific mRNA transcript expression in density gradient isolated cultured chicken erythrocytes under control conditions. One representative of four individuals is shown.

