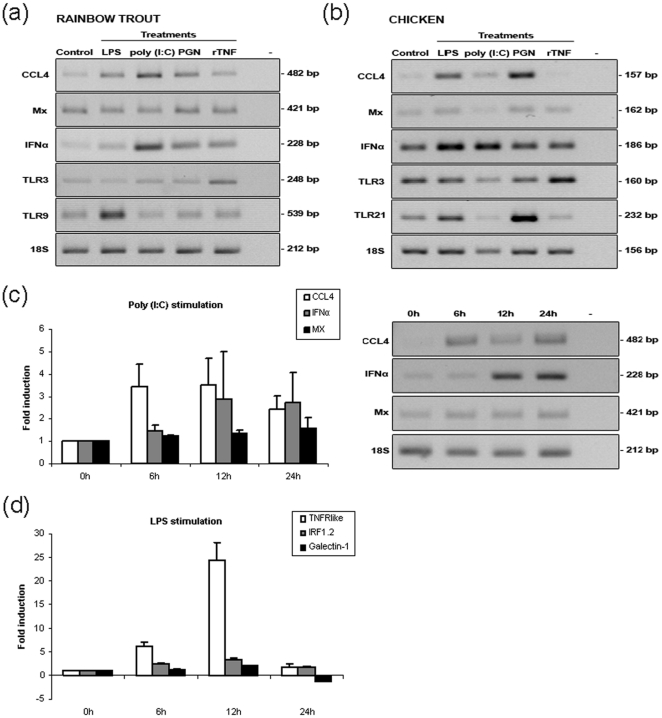
Figure 2. Analysis of specific mRNA transcript expression in cultured trout and chicken erythrocytes after PAMP or cytokine stimulation.
(a) Response of trout and (b) chicken erythrocytes after 12 hours exposure to: 50 µg/ml of LPS, 50 µg/ml of poly (I∶C), 5 µg/ml of PGN and 50 ng/ml of rTNF. CCL4, Mx, IFNα, TLR3 and TLR9 (TLR21 in chicken) mRNA abundance was analyzed by RT-PCR and 1.2% agarose gel electrophoresis. One representative of 3 and 4 individuals is shown for trout and chicken respectively. (c) RT-PCR analysis of the tEC response over time (6–24 h) to 50 µg/ml of poly (I∶C), densitometry data shown as fold changes (mean ± std.dev., n = 4 individuals) with respect to 18S rRNA. (d) Absolute Q-PCR analysis of the tEC response over time control (6–24 h) to 50 µg/ml of LPS, fold changes (mean ± std.dev., n = 4 individuals) in respect to specific transcript copy number.

