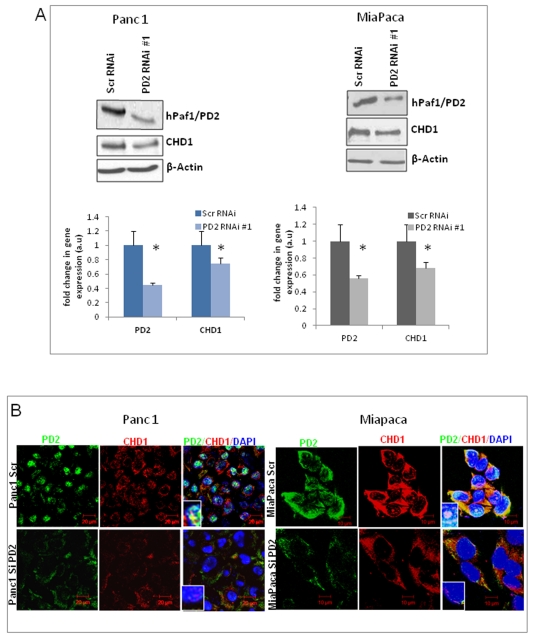
Figure 3. Downregulation of hPaf1/PD2 reduces the CHD1 protein level in PC cells.
(A) Western blot analysis shows a decreased level of the CHD1 protein in PC cells upon RNAi mediated hPaf1/PD2 inhibition. β-actin served as a loading control. The graph below each western blot figure represents the corresponding quantification results for individual cell lines. (B) Immunofluorescence analysis showing a reduced hPaf1/PD2 level (green) along with a corresponding reduction in CHD1 level (red) in PD2 siRNA treated PC cells compared to scrambled siRNA treated cells.

