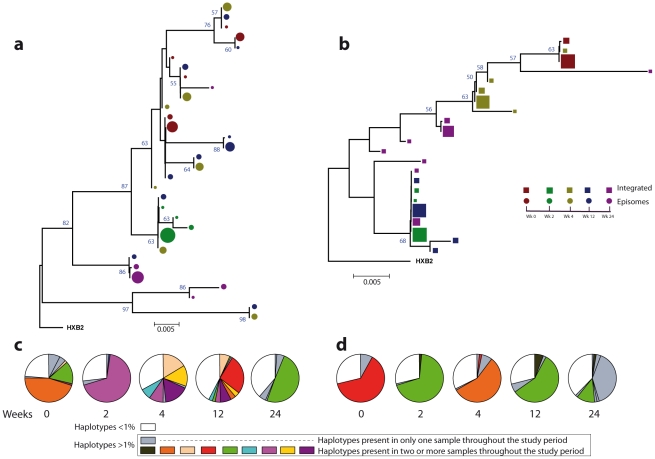
Figure 3. Phylogenetic tree and proportions of episomal and integrated HIV-1 sequences in patient 1.
A neighbor-joining approach, as implemented in MEGA4, was used to construct a phylogenetic tree with the best evolutionary model found in jModeltest v0.1.1. a. Circles represent longitudinal episomal DNA sequences. b. Squares represent longitudinal integrated DNA sequences. Legend of phylogenetic trees represents weeks available for further analysis. Sizes of the symbols represent the different percentages of clonal sequences. c. Longitudinal representation of the clonal variability of each episomal sample. d. Longitudinal representation of the clonal variability of each integrated sample. Areas of pie charts in white shading indicate sequences present with a frequency below 1%; gray shading indicates sequences with a frequency above 1% present in only one sample throughout the study period; colors represent sequences with a frequency above 1% present in two or more samples throughout the study period. 1,000 bootstrap replicates were performed; only values greater than 50% are shown at tree nodes.

