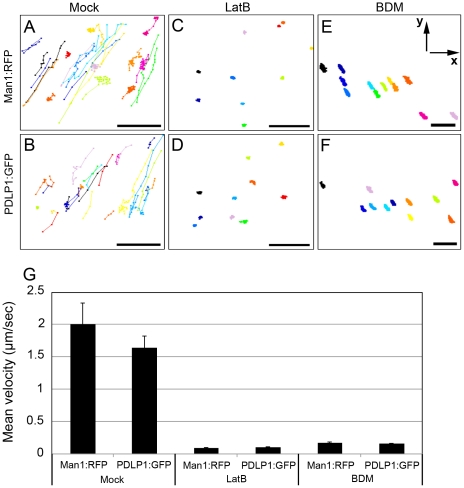
Figure 3. Effects of the microfilament inhibitor LatB and myosin inhibitor BDM on trafficking velocity of Golgi stacks marked by Man1:RFP or PDLP1:GFP labelled bodies.
(A–F) Tracks, represented by different colours, of the individual Man1:RFP fluorescent Golgi stacks (A, C, E) or PDLP1:GFP-tagged bodies (B, D, F) were imaged for 2 min in the presence of 0.1% DMSO (Mock; A, B), 10 µM LatB (C, D), or 10 mM BDM (E, F) and depicted via connected dots. (G) Mean of Man1:RFP (Golgi marker) and PDLP1:GFP velocity were calculated using images used in A–F. Number of investigated Golgi stacks and PDLP1:GFP, ≥27 (mock); ≥10 (Lat B, BDM). Axes are given in panel E. Scale bars, 10 µm.

