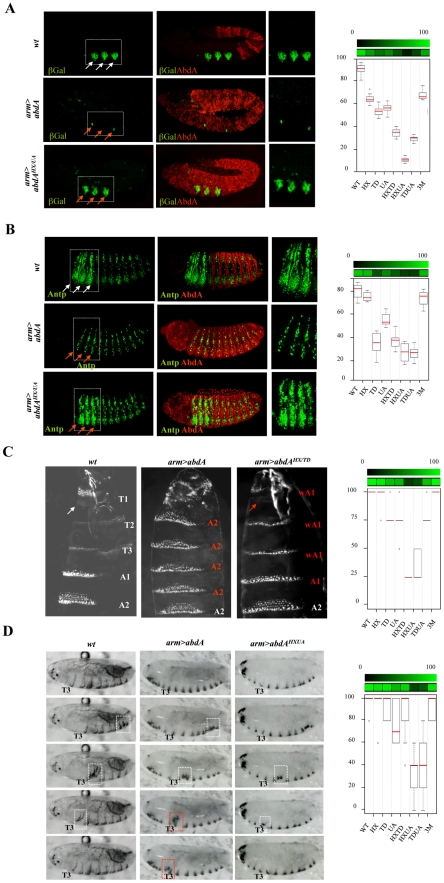
Figure 7. Mutually suppressive interaction of protein domains.
A. Thoracic restricted expression of Dll (white arrows) followed by Dll enhancer driven β-gal (green) results from repression by AbdA (red) in the abdomen (upper panel). Ubiquitous AbdA expression driven by arm-Gal4 represses Dll thoracic expression (red arrows, middle panels). The effect of the AbdAHX/UA variants is illustrated (lower panels). Right panels are magnification of boxed thoracic areas. B. Increased thoracic Antp expression (green, white arrows) results from AbdA (red) repression in the abdomen (upper panels). Ubiquitous AbdA expression driven by arm-Gal4 represses Antp expression in the thorax (red arrows, middle panels). The effect of the AbdAHX/UA variants is illustrated (lower panels). Right panels are magnification of boxed thoracic areas. C. Abdominal segments are characterized by refringent denticles organized in a trapezoidal shape in segments A2 but not A1, while T2/T3 thoracic segments harbors thinner denticles (left panel). Upon AbdA thoracic expression driven by arm-Gal4, the first abdominal segment A1 and thoracic segments acquire abdominal features, including abdominal type of denticles, trapezoidal organization of denticles and suppression of a T1 specific feature (white arrow), the “beard” (middle panel). Full or intermediate transformations were observed for AbdA variants (see Text S1 for quantifying criteria). The effect of the AbdAHX/TD variants is illustrated (right panel). Weak A1 (wA1) stands for a transformation of thoracic denticles toward abdominal type of denticles, with an organization typical of A1, but with only a partial suppression of the beard in T1 (arrow). D. Snapshots from movies illustrating locomotion in wild type larvae (left panels), or in larvae expressing ubiquitously AbdA (middle panels) or AbdAHX/UA variant (right panels) driven by the arm-Gal4 driver. White boxed areas show the progression of a peristaltic waves in the abdomen. The red boxed area shows an ectopic peristaltic wave in the thorax following ectopic AbdA expression in the thorax. Graphs in A–D (% of remaining activities compared to the wild type AbdA protein (WT) following domain mutations) using the boxplot representation summarize quantitative analyses (see Text S1 and Figure S7 (Dll), S8 (Antp), and S9 (A2 epidermal morphology) for full illustration, and Figure S10 for data on larval locomotion experiments. A graded color-coded bar above the graphs illustrates the level of protein activity, ranging from light green (full activity) to black (no activity).

