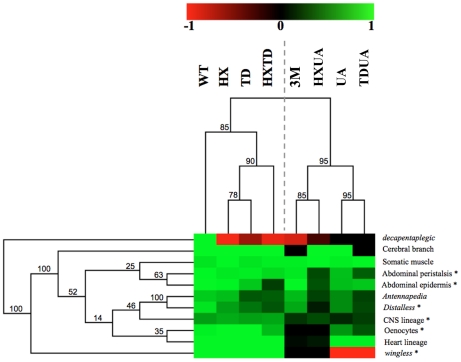
Figure 8. Hierarchical clustering of AbdA domain requirements.
Hierarchical clustering of domain contribution reveals two functional modules and a predominant role for the UA domain. A graded color-coded bar above the graphs illustrates the level of protein activity, ranging from light green (full activity) to black (no activity). Neomorphic activity is depicted in red. Asterisks indicate Exd dependent biological readouts. Jacknife values are indicated for each node.

