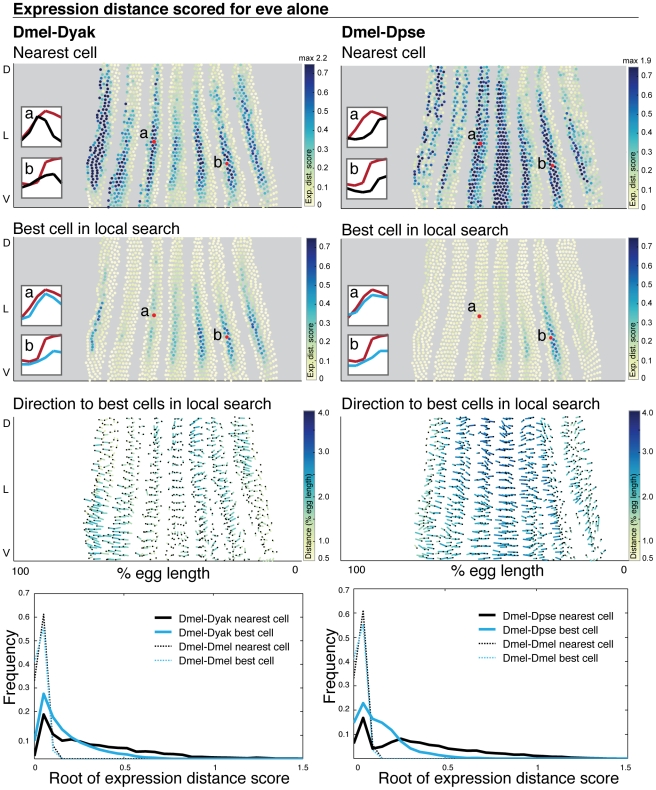
Figure 5. Even-skipped expression varies in relative position and intensity.
The expression distance score for each cell is plotted on a 2D representation of the embryo and the underlying gene expression profiles are illustrated in insets where gene expression is represented as a line trace over time. (1st row) For each D. melanogaster query cell, the expression distance score of the nearest target cell in D. yakuba (left) and D. pseudoobscura (right) is shown. (2nd row) The expression distance score for the best matched cell within the nearest 30 cells for both D. yakuba and D. pseudoobscura is shown. High expression distance scores, indicating poor matches, are darker. All cells scoring above 0.7 are colored the darkest blue; when the maximum value exceeds 0.7, the maximum value amongst all cells is reported at the top of the color map. Representative D. melanogaster cells are labeled, and their expression profiles are shown in the insets compared to their matches in D. yakuba or D. pseudoobscura (D. melanogaster cell in red, D. yakuba or D. pseudoobscura cell in blues - dark blue for nearest cell, light blue for best cell after local search). For each representative D. melanogaster cell, we list the label in the figure (a or b), the cell ID number, the target embryo to which it was matched (D. yakuba or D. pseudoobscura) and the expression distance score to the nearest target cell and the best matched target cell: a. 4314, D. yakuba, 0.719, 0.141; b. 5232, D. yakuba, 0.633, 0.557; a. 4314, D. pseudoobscura, 0.611, 0.066; b. 5232, D. pseudoobscura, 0.966, 0.524. (3rd row) For each D. melanogaster query cell, the distance and direction to the average position of the top 10 best corresponding target cells is shown. The correspondence is shown with a line that starts at the position of the query cell, and ends at the average position of the target cells. The end of the line is indicated with a black dot. Because the 2D projection distorts actual distance in 3D, the lines are color-coded to indicate actual distance traversed in 3D. Dark blue is a large distance, yellow is a small distance. (4th row) The distribution of expression distance scores using only the nearest cell (grey) and best-matched cell within the nearest 30 (blue) are shown; we plot the root of the expression distance score to separate values near zero. The distribution of expression distance scores narrows and the mean and median decrease after a local search (Table S3). To establish the significance of the calculated differences, we assembled two atlases from the D. melanogaster dataset, and compared these two atlases to each other (dotted lines).

