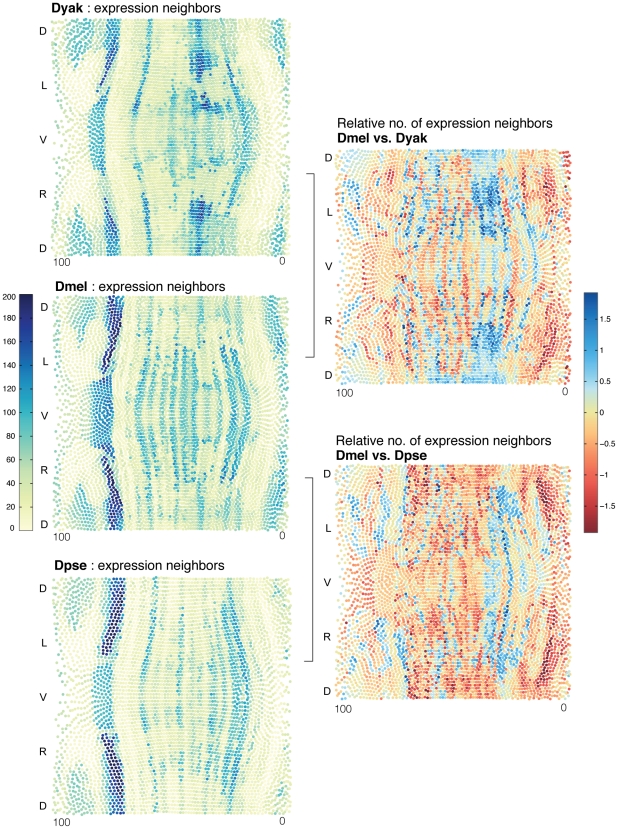
Figure 7. The proportion of cell types varies between D. melanogaster, D. yakuba, and D. pseudoobscura.
(Left) To compare the allocation of cell-types across species, we calculated the expression distance score to every other cell in each species' atlas (left). The number of adjacent cells below a given expression distance score is a measure of the size of a neighborhood of similar cells; we call these cells “expression neighbors.” Cells with many expression neighbors are blue. Cells with fewer are yellow. These sets of expression neighbors per cell provide a means to compare the relative allocation of cell types in the different embryos. For each D. melanogaster cell, the number of D. melanogaster expression neighbors is compared to the number of expression neighbors for its best corresponding cell in D. yakuba and D. pseudoobscura (right). Values displayed are the log ratio of the neighborhood sizes for corresponding cells in the two species being compared. D. melanogaster cells with relatively more expression neighbors are blue. D. melanogaster cells with relatively fewer are red.

