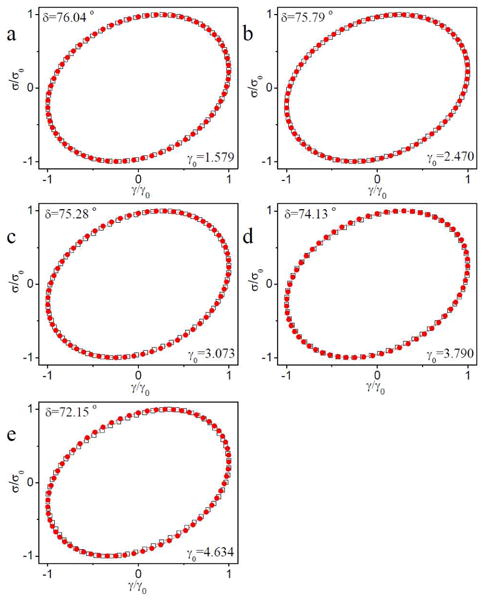
Figure 17.

Normalized stress versus strain (Lissajous-Bowditch curves) for the raw data of ∼ 0.11 g/mL PVP with 5% 1b during strain sweep from the critical strain (γcrit) to maximum strain (γmax) associated with strain hardening. The phase angle (δ) at different strains (γ0) is shown. Unfilled square symbol represent the raw data. Filled cycle symbols represent fits to data assuming that time-dependent strain and stress are both single-harmonic sinusoids. The raw phase angle from the experiments is used in the fits. Scanning frequency is 1 rad/s.
