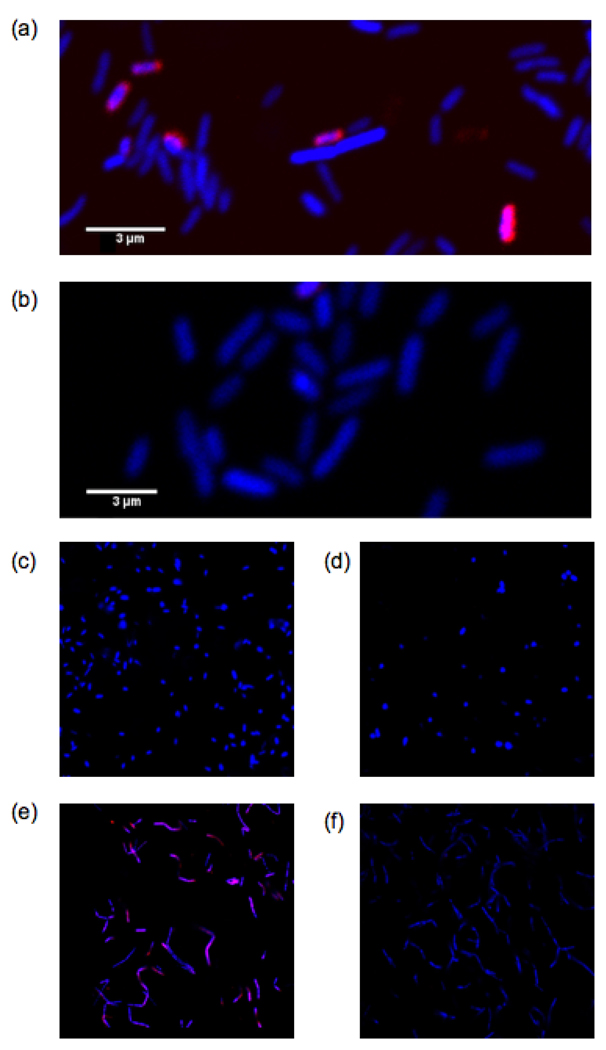
Figure 4.
Fluorescence imaging with dendrimers 10a and 10b (50 µM each). Images were obtained using a Zeiss LSM 710 laser scanning confocal microscope. Rhodamine fluorescence is shown in pink. Hoescht 33342 (blue), a DNA stain, was used as a control. (a), (b) Fluorescence imaging in S. typhimurium with 10a and 10b, respectively. (c), (d) Fluorescence imagining in V. harveyi with 10a and 10b, respectively. (e), (f) Fluorescence imaging in B. cereus with 10a and 10b, respectively.

