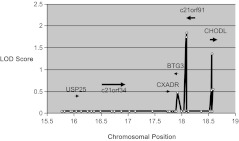
Figure 1.
Single nucleotide polymorphism (SNP) linkage plot. Logarithm of odds (LOD) scores are shown for each SNP tested within the human chromosome 21 region of interest. White circles denote the chromosomal locations (bp x 106) of the tested SNPs. LOD scores, shown on the y-axis, were computed with the Fastlink application using a dominant mode of inheritance of the cold sore phenotype (frequently affected vs unaffected) in the expanded data set of 43 families. The labeled black bars show the approximate gene locations with arrows indicating the direction of transcription.

