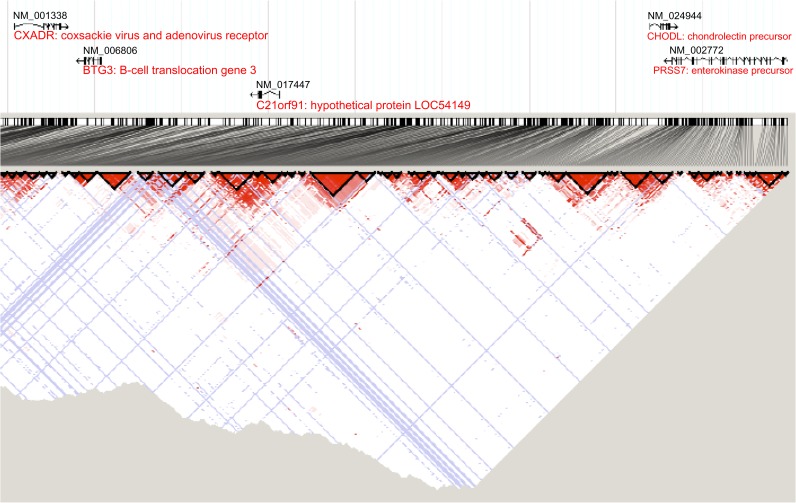
Figure 4.
Linkage disequilibrium within the cold sore susceptibility region. This plot showing linkage disequilibrium (LD) was generated in the Haploview computer application using data obtained from the HapMap CEU database (http://hapmap.ncbi.nlm.nih.gov). Areas of high LD are shown in red. Blue indicates areas without informative data. The relative locations of the genes are indicated above the plot. This data indicates that significant LD is not present between C21orf91 and the adjacent genes CHODL, BTG3, and CXADR.

