Figure 2.
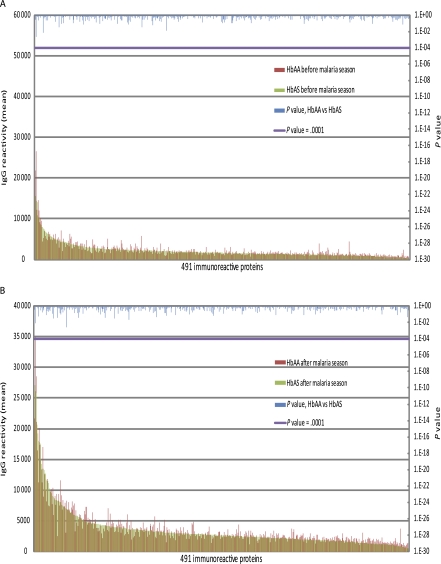
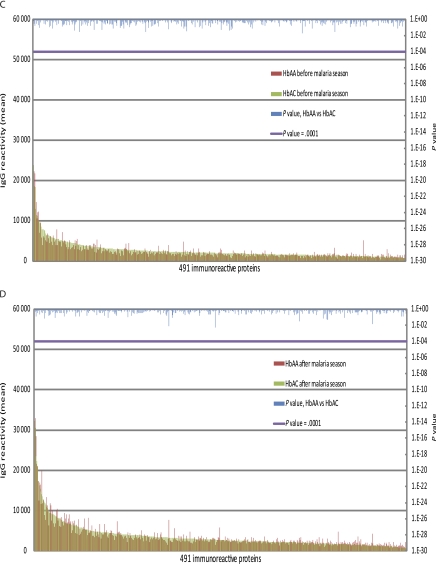
Hemoglobin S trait (HbAS) and hemoglobulin C trait (HbAC) are not associated with significant differences in the magnitude of the Plasmodium falciparum–specific immunoglobulin G (IgG) response. Shown is the average IgG reactivity specific for each of the 491 immunoreactive P. falciparum proteins measured in plasma collected before (A) and after (B) the malaria season from P. falciparum–uninfected children aged 2–10 y with either HbAA (n = 106) or HbAS (n = 15). There was no statistically significant difference in the level of IgG reactivity specific for the 491 proteins between the 2 groups of children at either time point. Also shown is the average IgG reactivity specific for each of the 491 immunoreactive P. falciparum proteins measured in plasma collected before (C) and after (D) the malaria season from P. falciparum–uninfected children aged 2–10 y with HbAA (n = 106) or HbAC (n = 20). There was no statistically significant difference in the level of IgG reactivity specific for the 491 proteins between the 2 groups of children at either time point. The Dunn–Bonferroni method was used to correct for the false discovery rate by setting the level of statistical significance at P = .0001 (β = α/n, where α = .05 and n = 491 tests performed).


