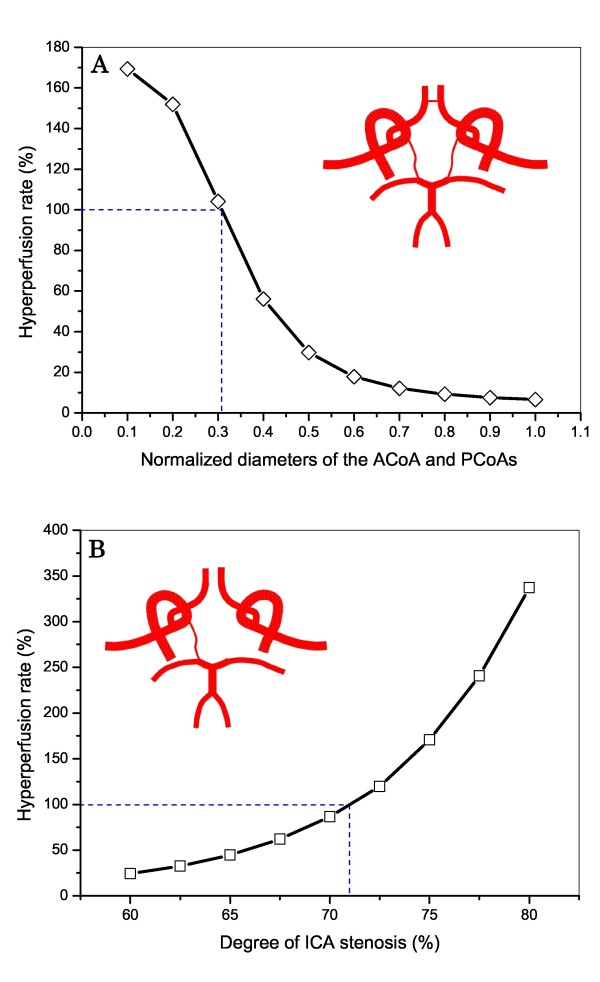
Figure 10.
Computed changes in hyperperfusion rate in the L. MCA with changes in: (A) the diameters of the cerebral communicating arteries (type 1 CoW structure), and (B) the degree of the ICA stenosis (type 6 CoW structure). In both cases, the stenosis is located in the left ICA. The diameter values shown in the horizontal axis of Figure 10(A) are normalized by the default values of the communicating arteries.

