
Figure 4.
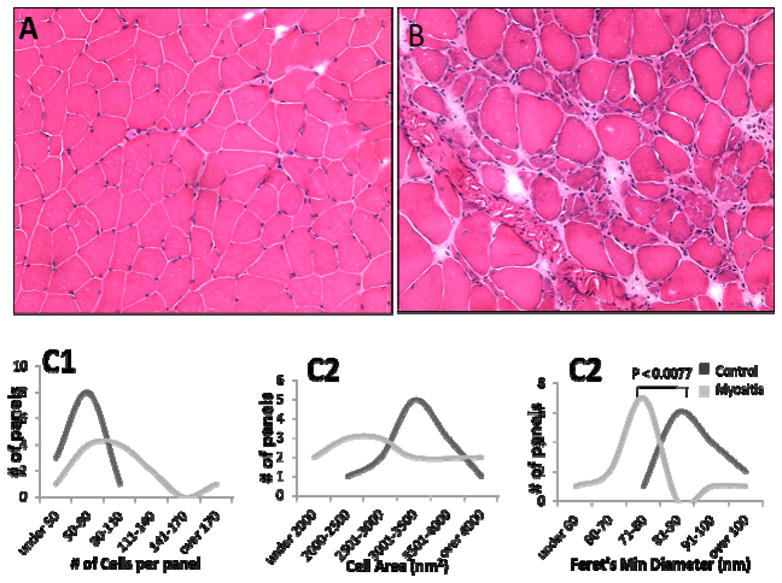
H&E staining of muscle of HT myositis mice: Representative sections of non-diseased mouse control (A) and HT mouse (B) muscle sections are shown (3 mice/genotype). Five panels per stained section were used to measure Cell count per panel (C1), cross-sectional area (C2) and Feret’s minimal diameter (C3). Cellular measurements were determined using ImageJ software downloaded from the NIH (http://rsbweb.nih.gov/ij/).