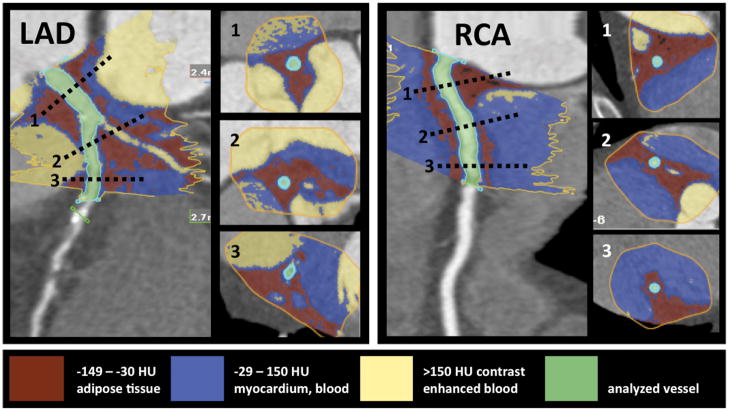
Figure 1.
Threshold based volumetric pericoronary adipose tissue quantification (left panel: LAD, right panel: RCA). The inserted cross-sections correspond to levels marked with dotted lines on the LAD and RCA. The manual tracing (yellow line) of the region of interest is performed on muliplanar-reformatted images perpendicular to the vessel centerline. The voxels within the predefined Hounsfield unit range are summarized, and the adipose tissue volume is calculated automatically. The red color indicates fat containing voxels. The blue color indicates the vessel wall, myocardium, and the non-enhanced blood pool. The yellow color indicates the contrast enhanced blood filled lumen and cavities. The green color indicates the analyzed vessel.

