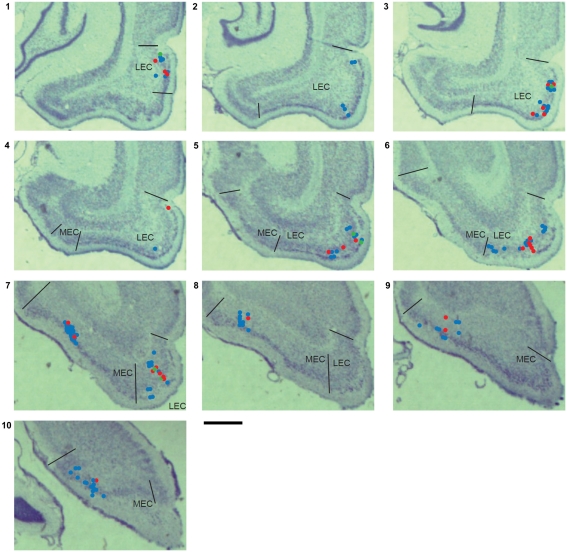
Figure 6.
Single unit recording locations. The locations of units recorded from all rats are marked on coronal sections from one of the rats used in this study. Red dots indicate the locations of units with pmin(ORI) < 0.05 shown in Figures A2 and A3 in Appendix. Green dots indicate the locations of LEC putative place cells firing away from objects shown in Figure A2 in Appendix. Blue dots show the locations of unclassified units. These sections are 470 μm apart (assuming a 15% histological shrinkage factor), and approximately correspond to the following plates in the Paxinos and Watson (1998) rat brain atlas: section 1: plate 42 (bregma −5.6 mm) to section 10: plate 55 (bregma −8.8 mm). Scale bar is 1 mm.

