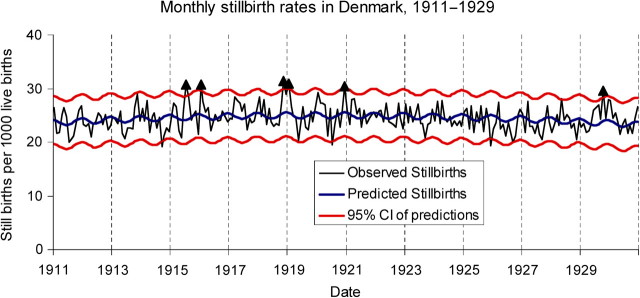
Figure 3.
Lack of trends in monthly stillbirths in Denmark. Stillbirths are shown as excess numbers per 1000 live births, after normalization by long-term mean. Although there is a significant excess of stillbirths in November 1918 and January 1919, it is not a particularly dramatic or long-lasting signal. The red lines indicate the 95% confidence interval (CI).

