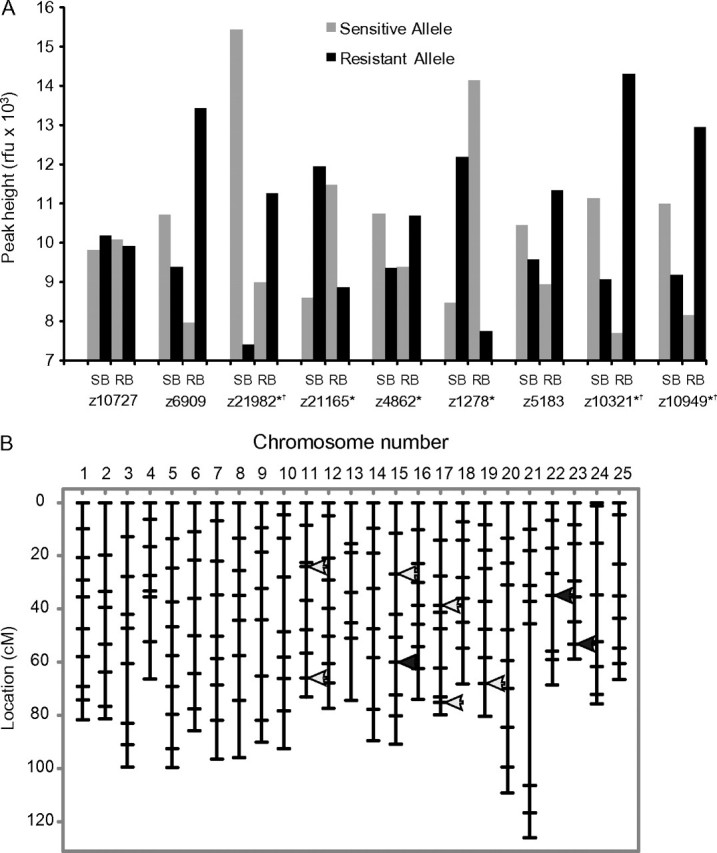
FIG. 3.

Microsatellite markers identified by BSA which cosegregate with sensitivity differences observed in the F2 bulks. (A) Relative peak intensities observed in sensitive and tolerant bulks for each candidate marker identified. Individuals from each bulk were genotyped independently to confirm skewed allele distributions (*p = 0.05, †p < 0.01). (B) Genomic location of candidates. Arrows indicate all candidate markers identified; solid arrows identify the loci found to be highly significant (qtl/Cartographer).
