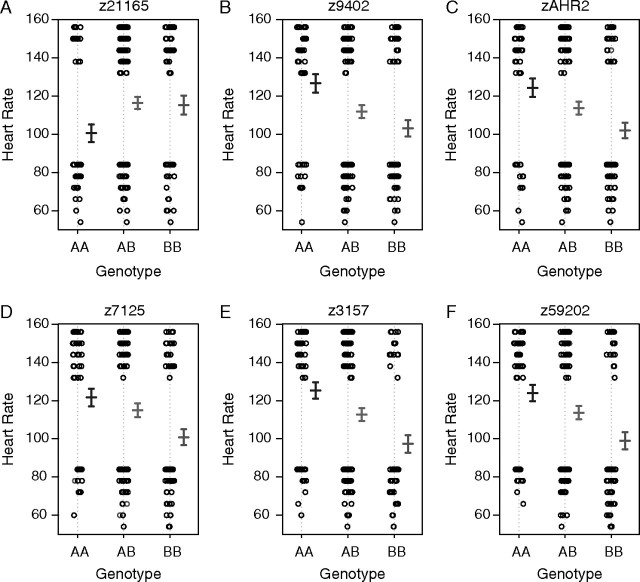
FIG. 5.
Main effect plots displaying the phenotype-to-genotype relationship for each marker closest to the QTLs identified by the 1D scan (A–F). For each marker genotype, the individual phenotype is plotted, with the mean of genotype AA, AB, and BB. Error bars represent ± 1 SEM. Microsatellite allele sizes (bp) for “AA” and “BB,” respectively, are 139/139 and 157/157 (z21165), 260/260 and 258/258 (z9402), 221/221 and 229/229 (zAHR2), 220/220 and 184/184 (z7125), 104/104 and 128/128 (z3175), and 267/267 and 234/260 (z59202).

