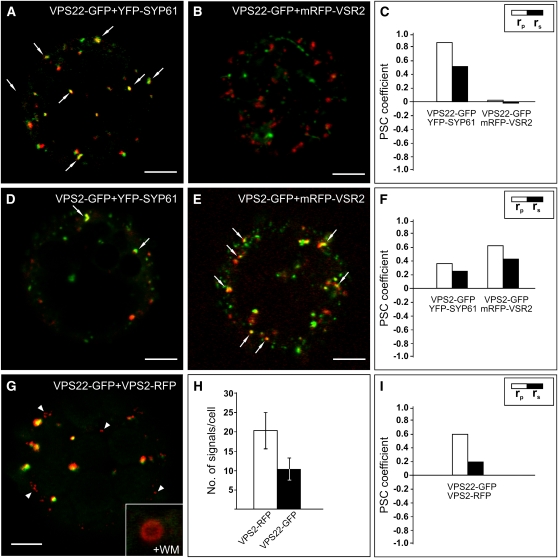
Figure 6.
Gradual Distribution of the ESCRT-II Component VPS22 and the ESCRT-III Component VPS2.
Tobacco mesophyll protoplasts were transfected with plasmids encoding fluorescent markers/reporters as indicated below. Proteins were expressed for 18 to 24 h prior to CLSM analysis. White arrows indicate colocalization. For quantification, the PSC coefficients (rp and rs) were calculated after analysis of at least 10 individual protoplasts and a minimum of 200 signals. The level of colocalization ranges from +1 for perfect correlation to −1 for negative correlation. For the corresponding scatterplots of the fluorescence values of pixels across the two channels, see Supplemental Figure 2 online.
(A) Coexpression of VPS22-GFP and the TGN/EE marker YFP-SYP61.
(B) VPS22-GFP was coexpressed with the MVB/LE marker mRFP-VSR2.
(C) Quantification of VPS22-GFP colocalization with TGN/EE (YFP-SYP61) and MVB/LE (mRFP-VSR2) marker.
(D) Coexpression of VPS2-GFP and YFP-SYP61.
(E) VPS2-GFP and mRFP-VSR2 were coexpressed.
(F) Quantification of VPS2-GFP colocalization with TGN/EE and MVB/LE marker.
(G) Coexpression of VPS22-GFP and VPS2-RFP. Some VPS2-RFP signals do not colocalize (white arrowheads). Only VPS2-RFP signals localize to WM-sensitive compartments, as indicated by the magnified ring-like structure.
(H) Quantitative comparison of the number of VPS2-RFP and VPS22-GFP signals. Error bars indicate the sd of numbers of signals.
(I) Quantification of VPS22-GFP and VPS2-RFP colocalization.
Bars = 5 μm.

