Figure 8.
VPS2-DN Causes Marker Proteins for TGN/EE and MVB/LE to Colocalize.
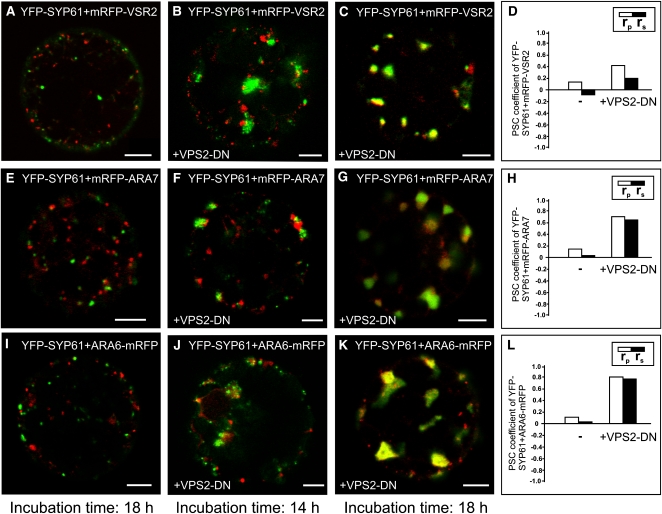
Tobacco mesophyll protoplasts were transfected with plasmids encoding for fluorescent markers/reporters as indicated below. Proteins were expressed for 18 h prior to CLSM analysis. For quantification, the PSC coefficients (rp and rs) were calculated after analysis of at least 10 individual protoplasts and a minimum of 200 signals. The level of colocalization ranges from +1 for perfect correlation to −1 for negative correlation. For the corresponding scatterplots of the fluorescence values of pixels across the two channels, see Supplemental Figure 5 online.
(A) Coexpression of TGN/EE and MVB/LE markers YFP-SYP61 and mRFP-VSR2 18 h after transfection.
(B) Effect of VPS2-DN on the distribution of TGN/EE and MVB/LE markers 14 h after transfection.
(C) Analysis 18 h after transfection: VPS2-DN causes a change in the signal pattern of the marker proteins. The signals accumulate in bigger but fewer structures.
(D) Quantification of the marker colocalization. The rp and rs values increase when VPS2-DN is expressed.
(E) Coexpression of TGN/EE and MVB/LE markers YFP-SYP61 and mRFP-ARA7 18 h after transfection.
(F) Effect of the VPS2-DN coexpression with YFP-SYP61 and mRFP-ARA7 14 h after transfection.
(G) When expressed for 18 h, VPS2-DN increases colocalization of YFP-SYP61 and mRFP-ARA7. As observed in (C), the signals change structurally.
(H) Quantification reveals higher rp and rs values for the marker proteins when VPS2-DN is expressed.
(I) to (L) An experiment as described in (E) to (H) was performed, except ARA6-mRFP was used as MVB/LE marker. Here, the highest increase of rp and rs values is found (L).
Bars = 5 μm.

