Figure 7.
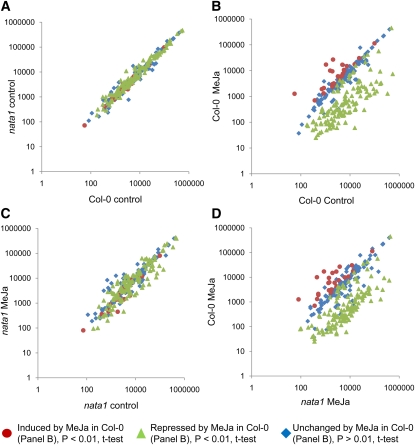
Metabolite Changes Induced 4 d after MeJA Treatment of Wild-Type Col-0 and nata1-1 Mutant Plants.
(A) Comparison of metabolites in Col-0 and nata1-1 in the absence of MeJA treatment.
(B) Comparison of metabolites in Col-0 with and without MeJA treatment.
(C) Comparison of metabolites in nata1-1 with and without MeJA treatment.
(D) Comparison of MeJA-induced metabolites in Col-0 and nata1-1. Each data point represents the average of eight independent measurements. x and y axis units are arbitrary (mass spectrometer counts). Symbols represent the same group of metabolites in each figure, indicating those that are unaltered (diamonds), significantly induced (circles), or significantly repressed (triangles) by MeJA treatment of wild-type Col-0 in (B).
[See online article for color version of this figure.]

